Analyzing Phoenix
“If you can’t measure it, you can’t improve it”- Peter Drucker
Is having a dedicated analyst role in your company the key to success?
Are companies that have analyst roles more successful than ones that do not?
Is data analysis worth investing in for Small Businesses?
What kind of impact does data analysis have on growing companies?
These are the questions that we seek to gain insight on as we analyze Phoenix...
Welcome
“If you can’t measure it, you can’t improve it” Said Peter Drucker a well respected management consultant known for his contributions to the foundation of the modern business corporation.In today’s business world those words have never been more true.
Businesses of every size need tools, methods and people to clean, organize, interact, and extract valuable insights from their data. Having a business that does not analyze their data is akin to “Flying Blind”. Nearly every business can agree that data analysis is important to business success and growth and we believe that this will only become more and more apparent as we continue to create and grow in our technologically connected world.
Abstract
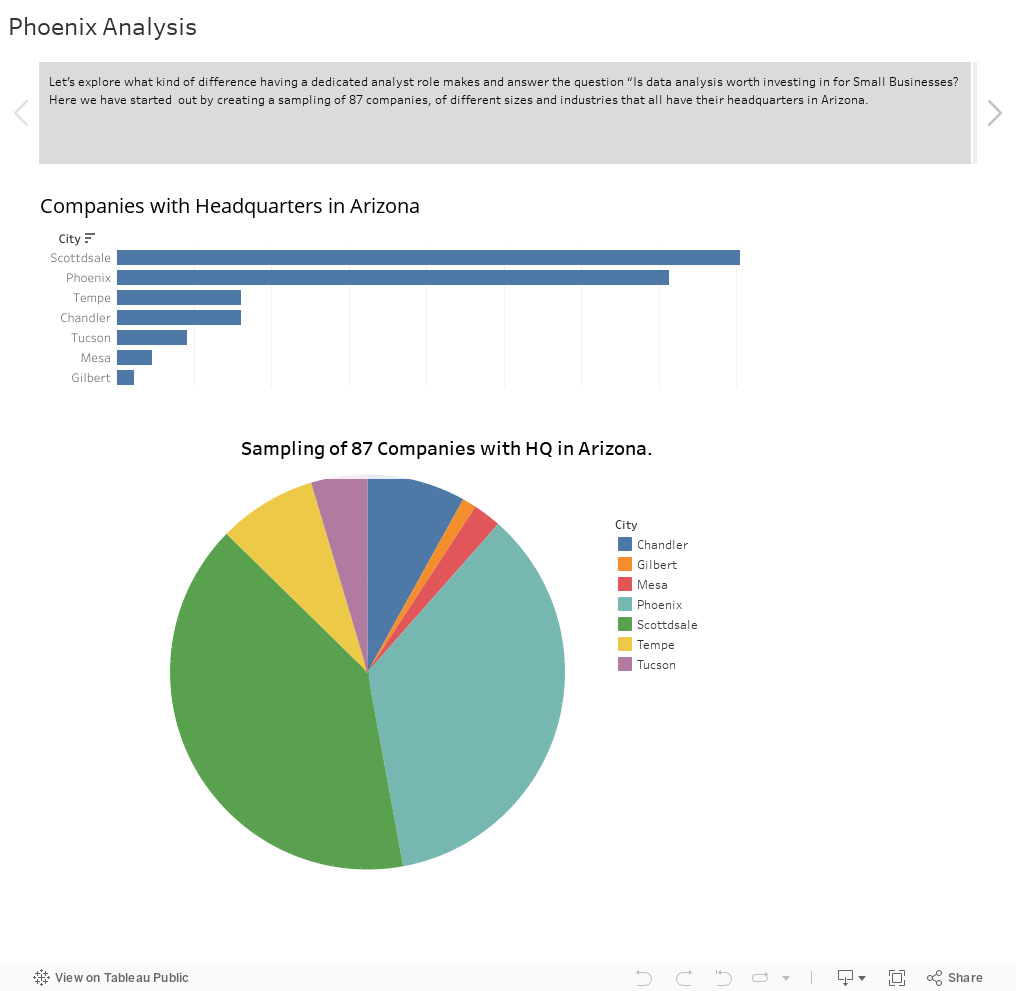
This project provides a look into the company size, revenue, industry and rating of 87 Companies with headquarters in Arizona.
We explore these variables and are able to gain a deeper understanding of variety of companies present.
We are interested in finding the similarities between companies that have designated analyst positions.
Web scraping and web research was used to gather information and produce word clouds, Excel & Tableau have been used for calculations and visual analysis. Sentiment Analysis was performed on the business statements using python and pretrained sentiment analysis model called Vader.
Findings indicate that analyst roles do exist and many times in high volume, for the larger majority of substantial companies ranging from 501-Thousands of employees. Only 67% of mid sized companies (101-500 employees) have designated analyst roles and 21% for small businesses with (1-100 employees). Small companies nearing mid-size, appear to pivot their thinking towards having a designated analyst role and at that stage become 3x more likely to create the designated analyst role within the company.
Growing a business is a journey and these days there is no autopilot, you have to pay attention to road. A businesses industry, founder, funding and marketing all effect the trajectory of a companies growth. Investing in data is like investing in the beams that hold up your business.The beams are the very structure that hold everything else in place. You can’t go wrong when you have a hand on what is solid.
Introduction
We have performed analysis on data surrounding companies that have headquarters in Arizona because these are companies are part of our local communities. These are the companies that grow to employ our new graduates, fathers, mothers, brothers and sisters and that shape the landscape of Arizona’s future.
We live in a diverse community and businesses here are run by individuals that span many age groups, nationalities, and their companies too, deal and work in a variety of different industries. From the senior assembly line QC inspector at the semiconductor plant to the Segway riding digital media assistant for a local SaaS startup, All businesses seek to build and grow and all employees seek stable and prosperous roles.
For all businesses the landscape is constantly changing, from the techniques, and technology we use to the audience and market we sell to. What if there was a way to grow faster, more intelligently, with less turnover, higher quality product, greater customer satisfaction and better work life balance? What if business leaders could less time wondering what was going on in their company and in the world and more time adapting to and empowering themselves with the information not only to meet the needs of the world and community they serve but excel, thrive and prosper?
Through our analysis we are looking for the impact that a “designated analyst role” has on a companies revenue. We feel that there is a direct connection between large and successful businesses and designated analyst roles. We feel that analyst roles are many times and for whatever reason, underrated, undervalued and haphazardly combined with other roles. Through lack of designated focus, siloed management, or unjust hierarchy, the role of the analyst seems to be denied the true power of its proven impact. Our goal is to share evidence that prompts understanding of why creating designated analyst roles is the oldest but newest “BEST PRACTICE”.
Methods
Methods used for sampling and data collection include web scraping with python, business listings information from glassdoor.com linkedin.com, business information databases: dnb.com, growjo.com, and listing directories on gregslist.com & azbigmedia.com.
We collected a sampling of 87 companies. Variables found for these include, company age, company size (determined by number of employees), company annual revenue, company ratings, company location, company industry, and sentiment analysis ratings from business statement.
Data visualizations were created to show the patterns and anomalies in this data. During the “Analyst” role search where we looked at all current company titles, ANY title including the specific word “Analyst” qualified as a YES. For example titles such as Business Analyst, Marketing Analyst, Process Analyst, Agile Analyst, Technical Data Analyst etc.
Limits to the analysis include this data being only valid for the year it was collected, a one year snapshot as far as revenue and the ratings are variable as the information changes over time as it is added to. We were able to find business data as current as 2019 from a combination of sites and online databases.Tableau was used to break down data and identify patterns and distinctions that relate to a companies overall status.
Results
Through the analysis we were able to find a number of interesting correlations between company size, revenue and instance of analyst roles. We can say that overall there is a larger portion of companies that have analyst roles, however it is a firm and prominent feature of the larger companies. We can confidently agree that there is a connection between large scale revenue and the prominence of designated analyst roles. Our conclusion supports the hypothesis and pushes us to further investigate the reasons why companies especially small-mid size ones are reluctant to create designated analyst roles. Some companies boast ¾ of the workforce in sales or executive roles, none which encompass the job of analyzing data of any area within the company. If we were to delve deeper into this subject, we would definitely want to preform some predictive analysis to illustrate the actual rate of revenue increase after the enablement of a dedicated analyst role. We could also explore in more detail the reason why this role is not being adopted earlier on in the business journey,(through online surveys, potentially) and develop a strategy to share our findings with those companies who will benefit.
More Information and Resources:
Small businesses don’t think they need analysts but they do.
Why your team needs business analysts.
The importance of having a marketing analytics role at your company.
Marketing Analytics role listed as an Essential Role for your marketing team.
The case for hiring a dedicated marketing analytics position.
Hire a sales analyst.
Why we need business analysts
The importance of the business analyst role.
Why you need a marketing analyst on your team.
Business analyst is an essential operational role.
3 Reasons companies are hiring business analysts.
Why you need a business analyst.
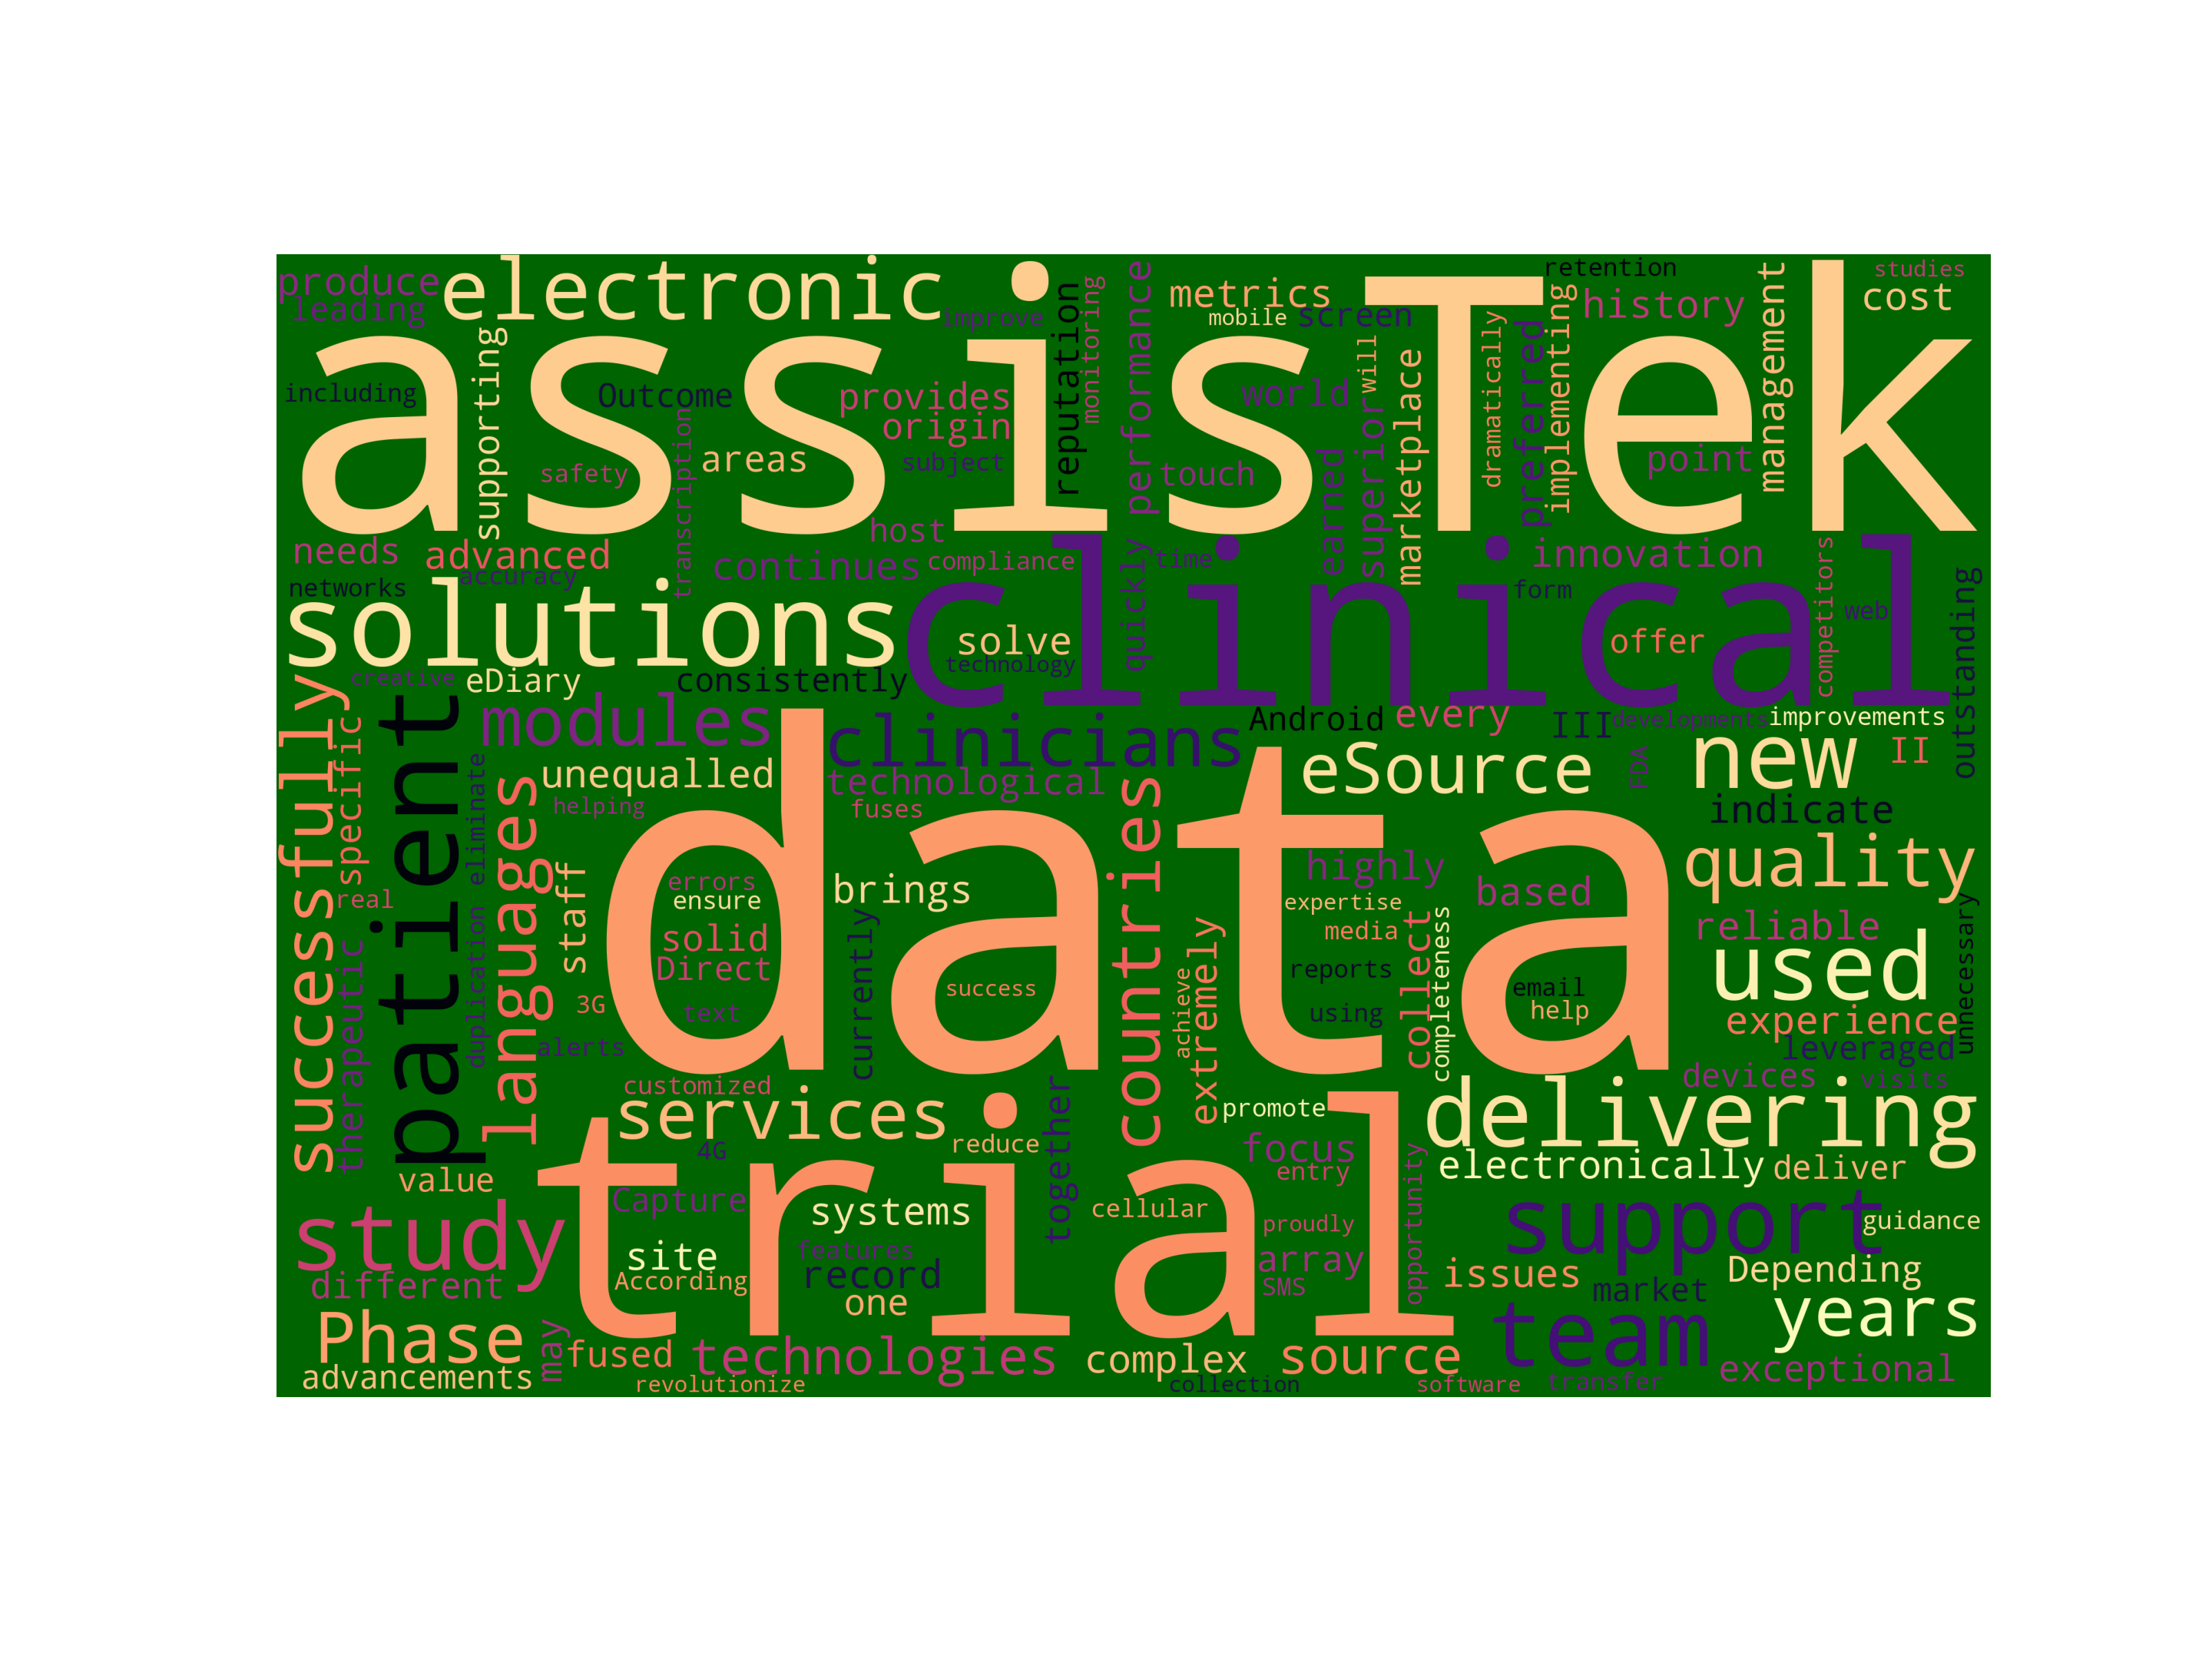
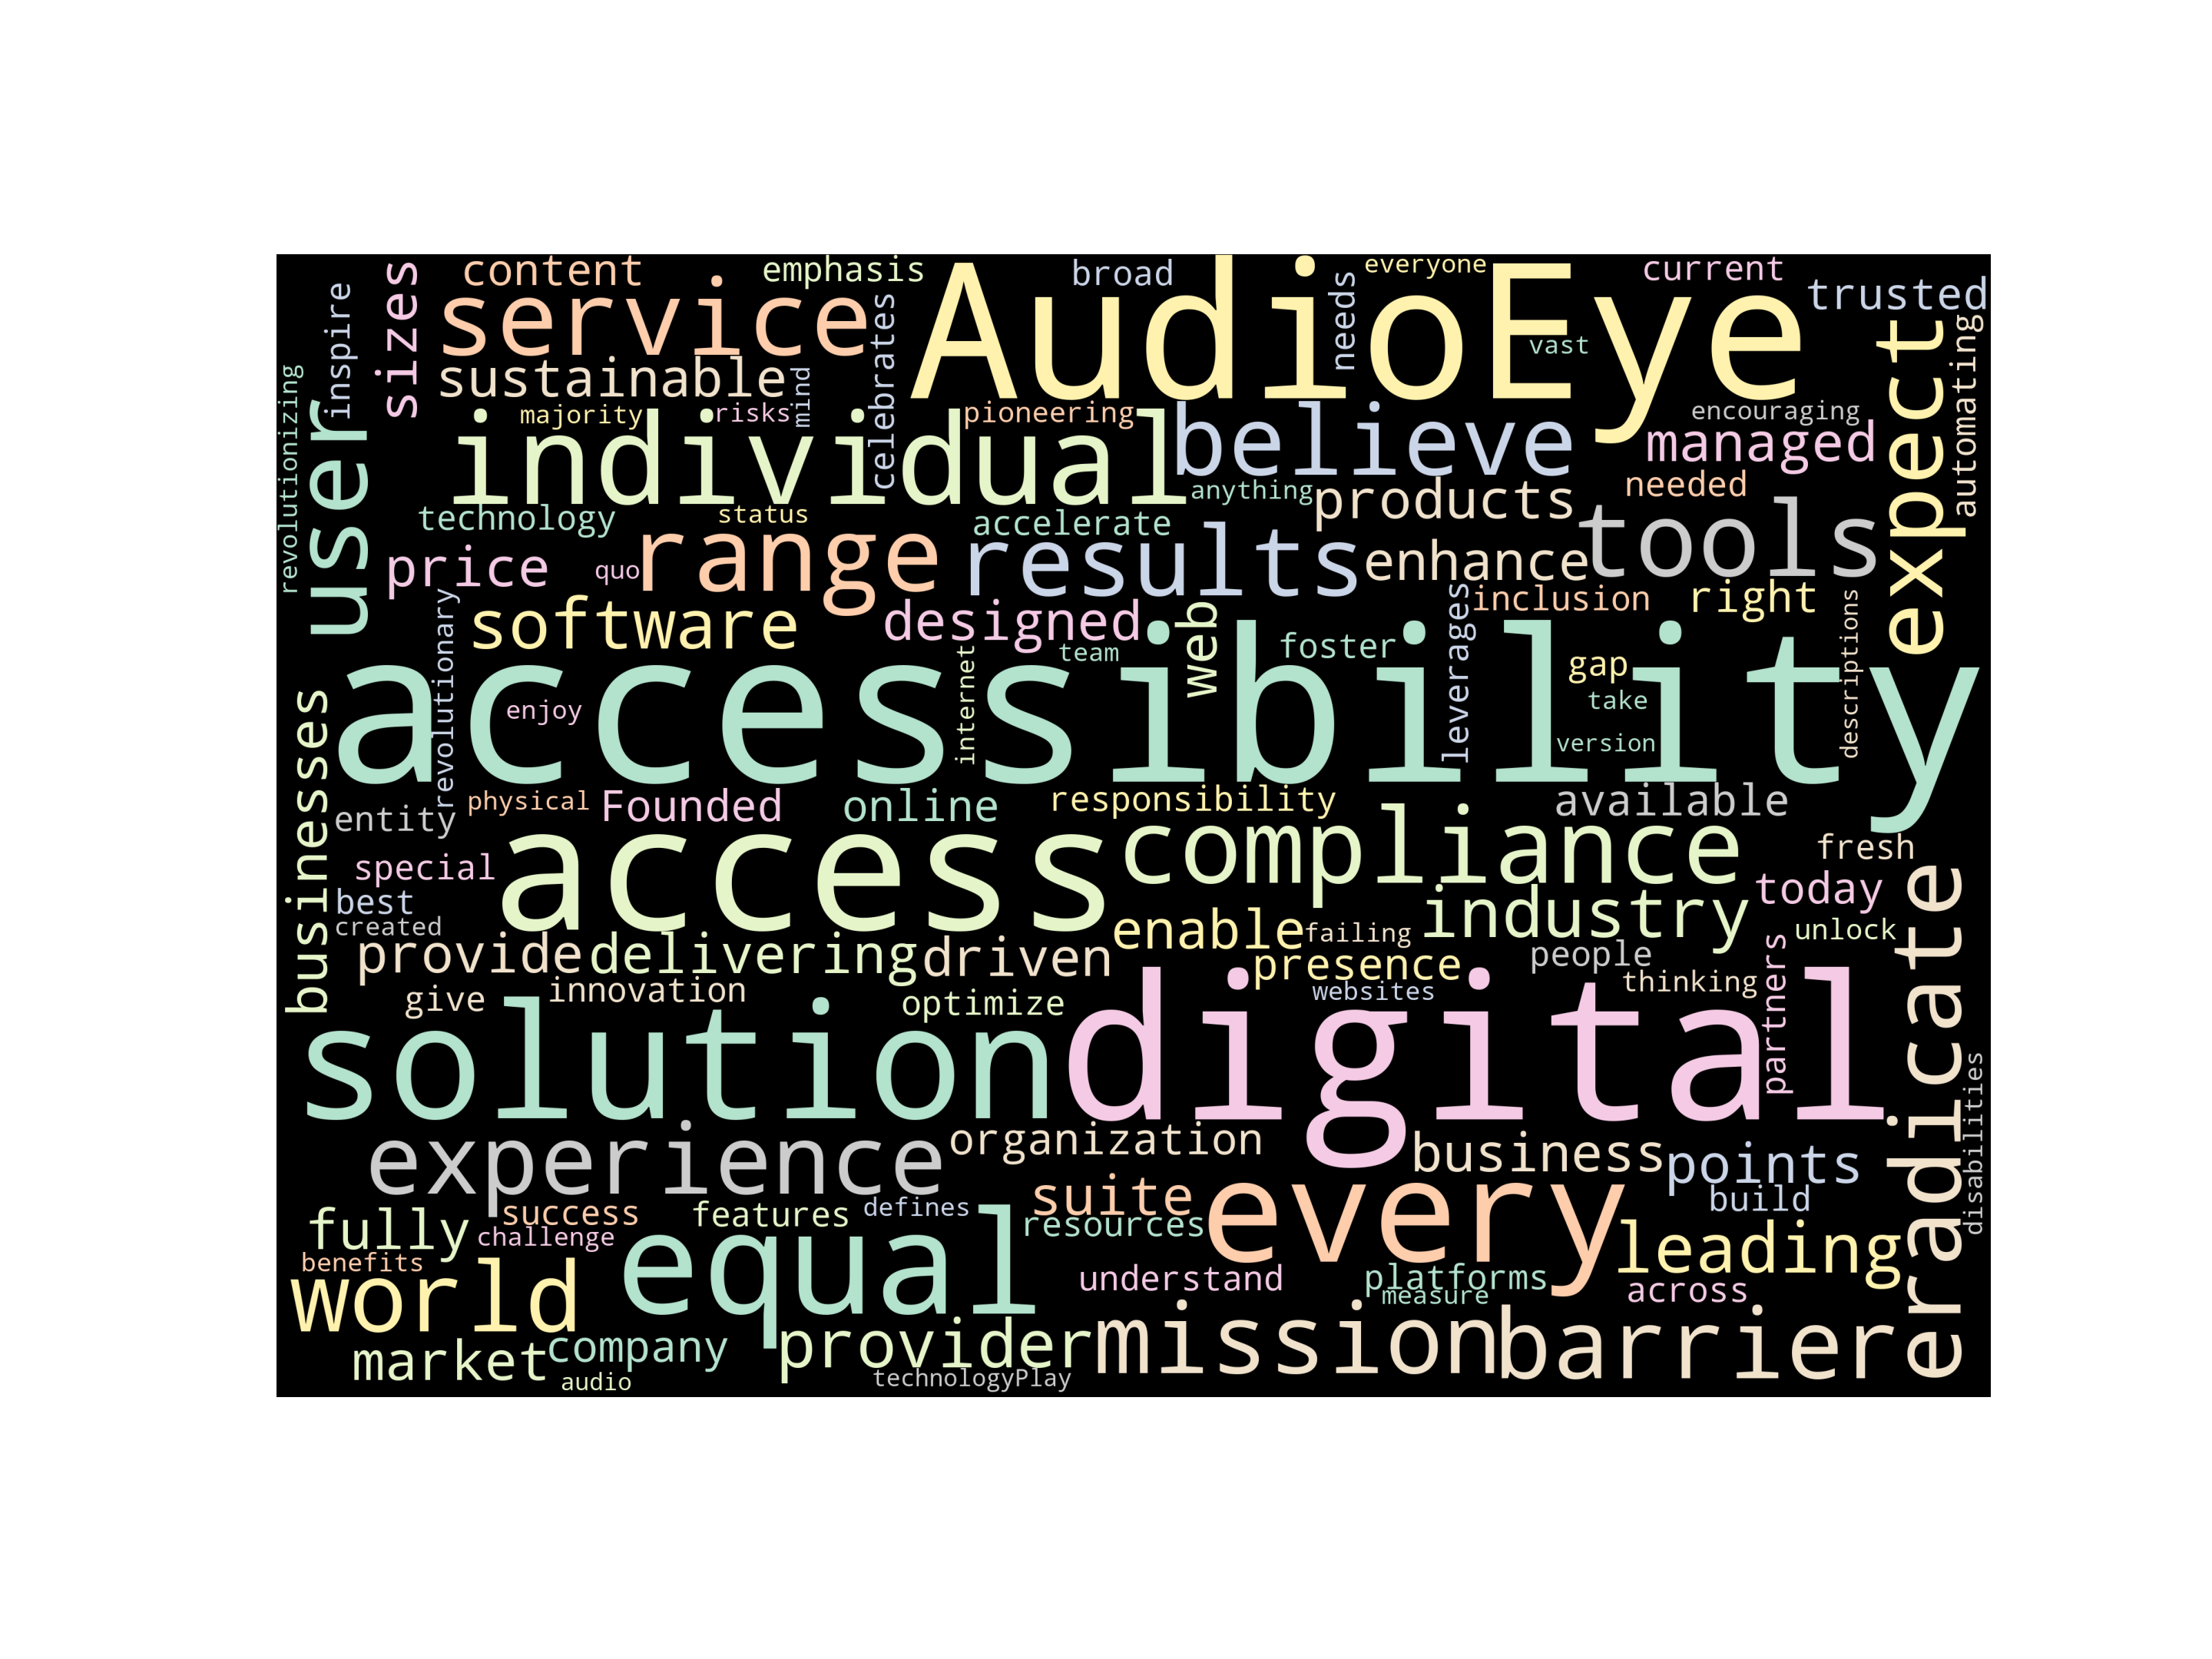
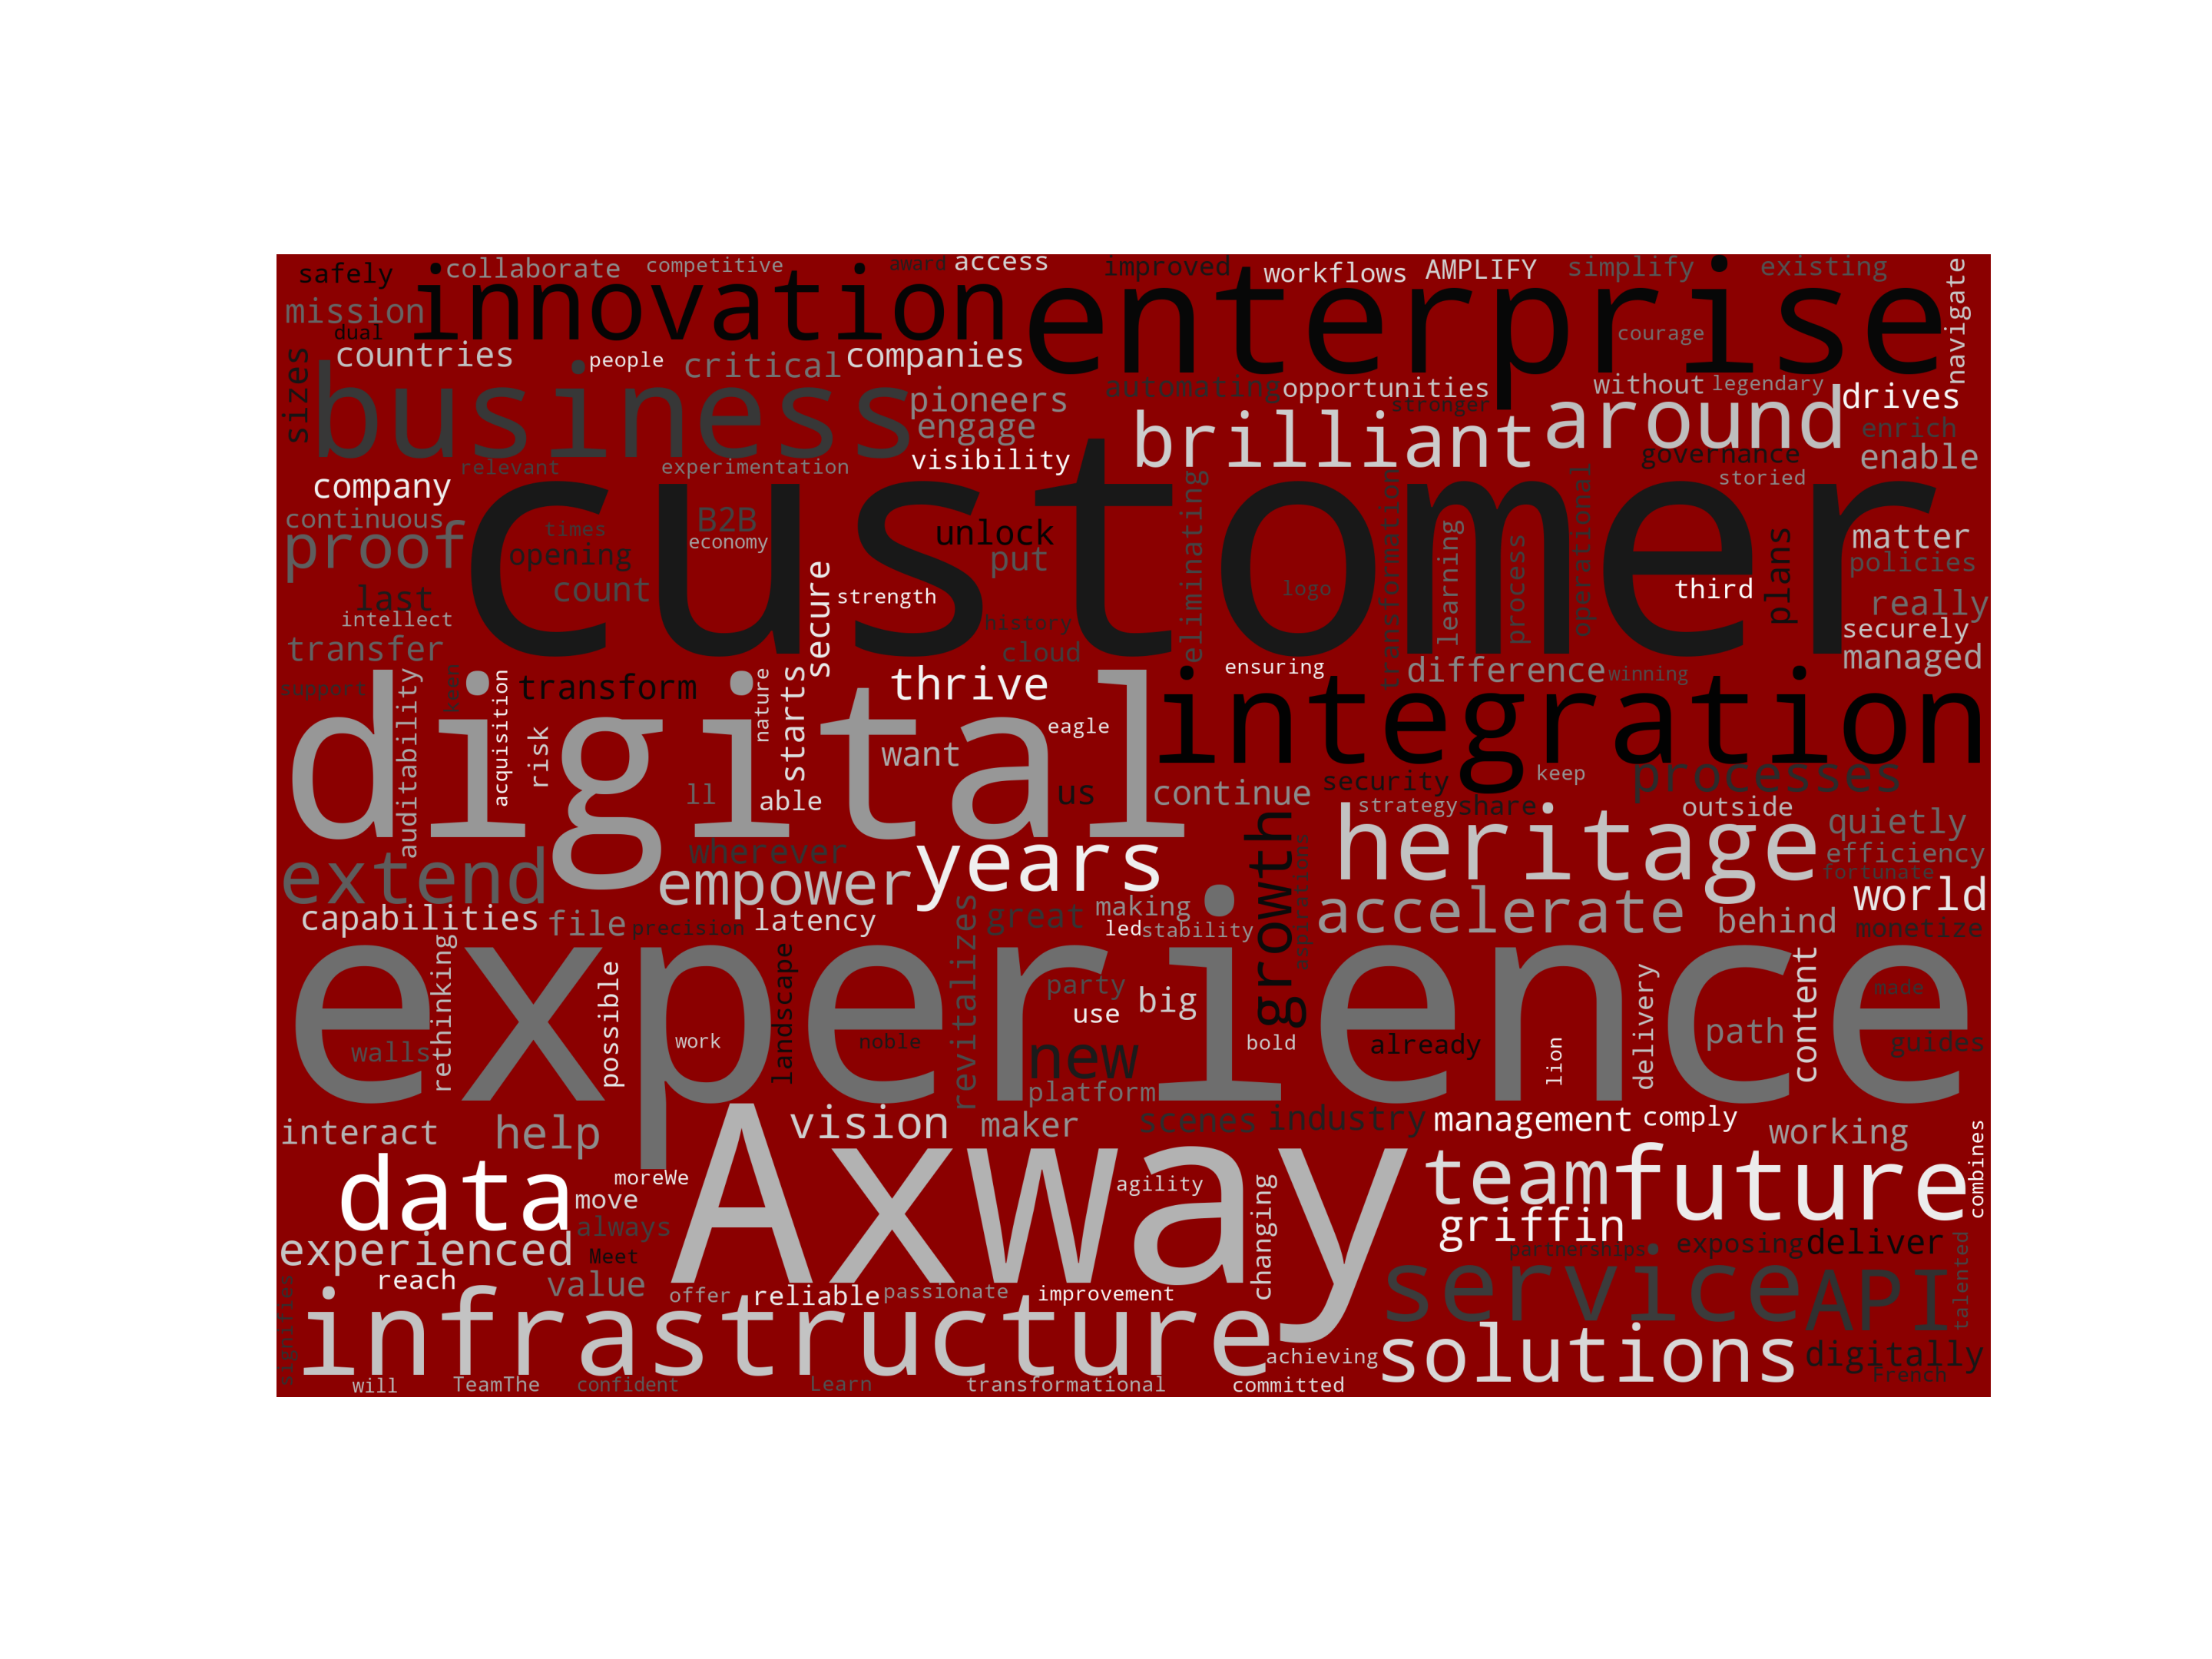
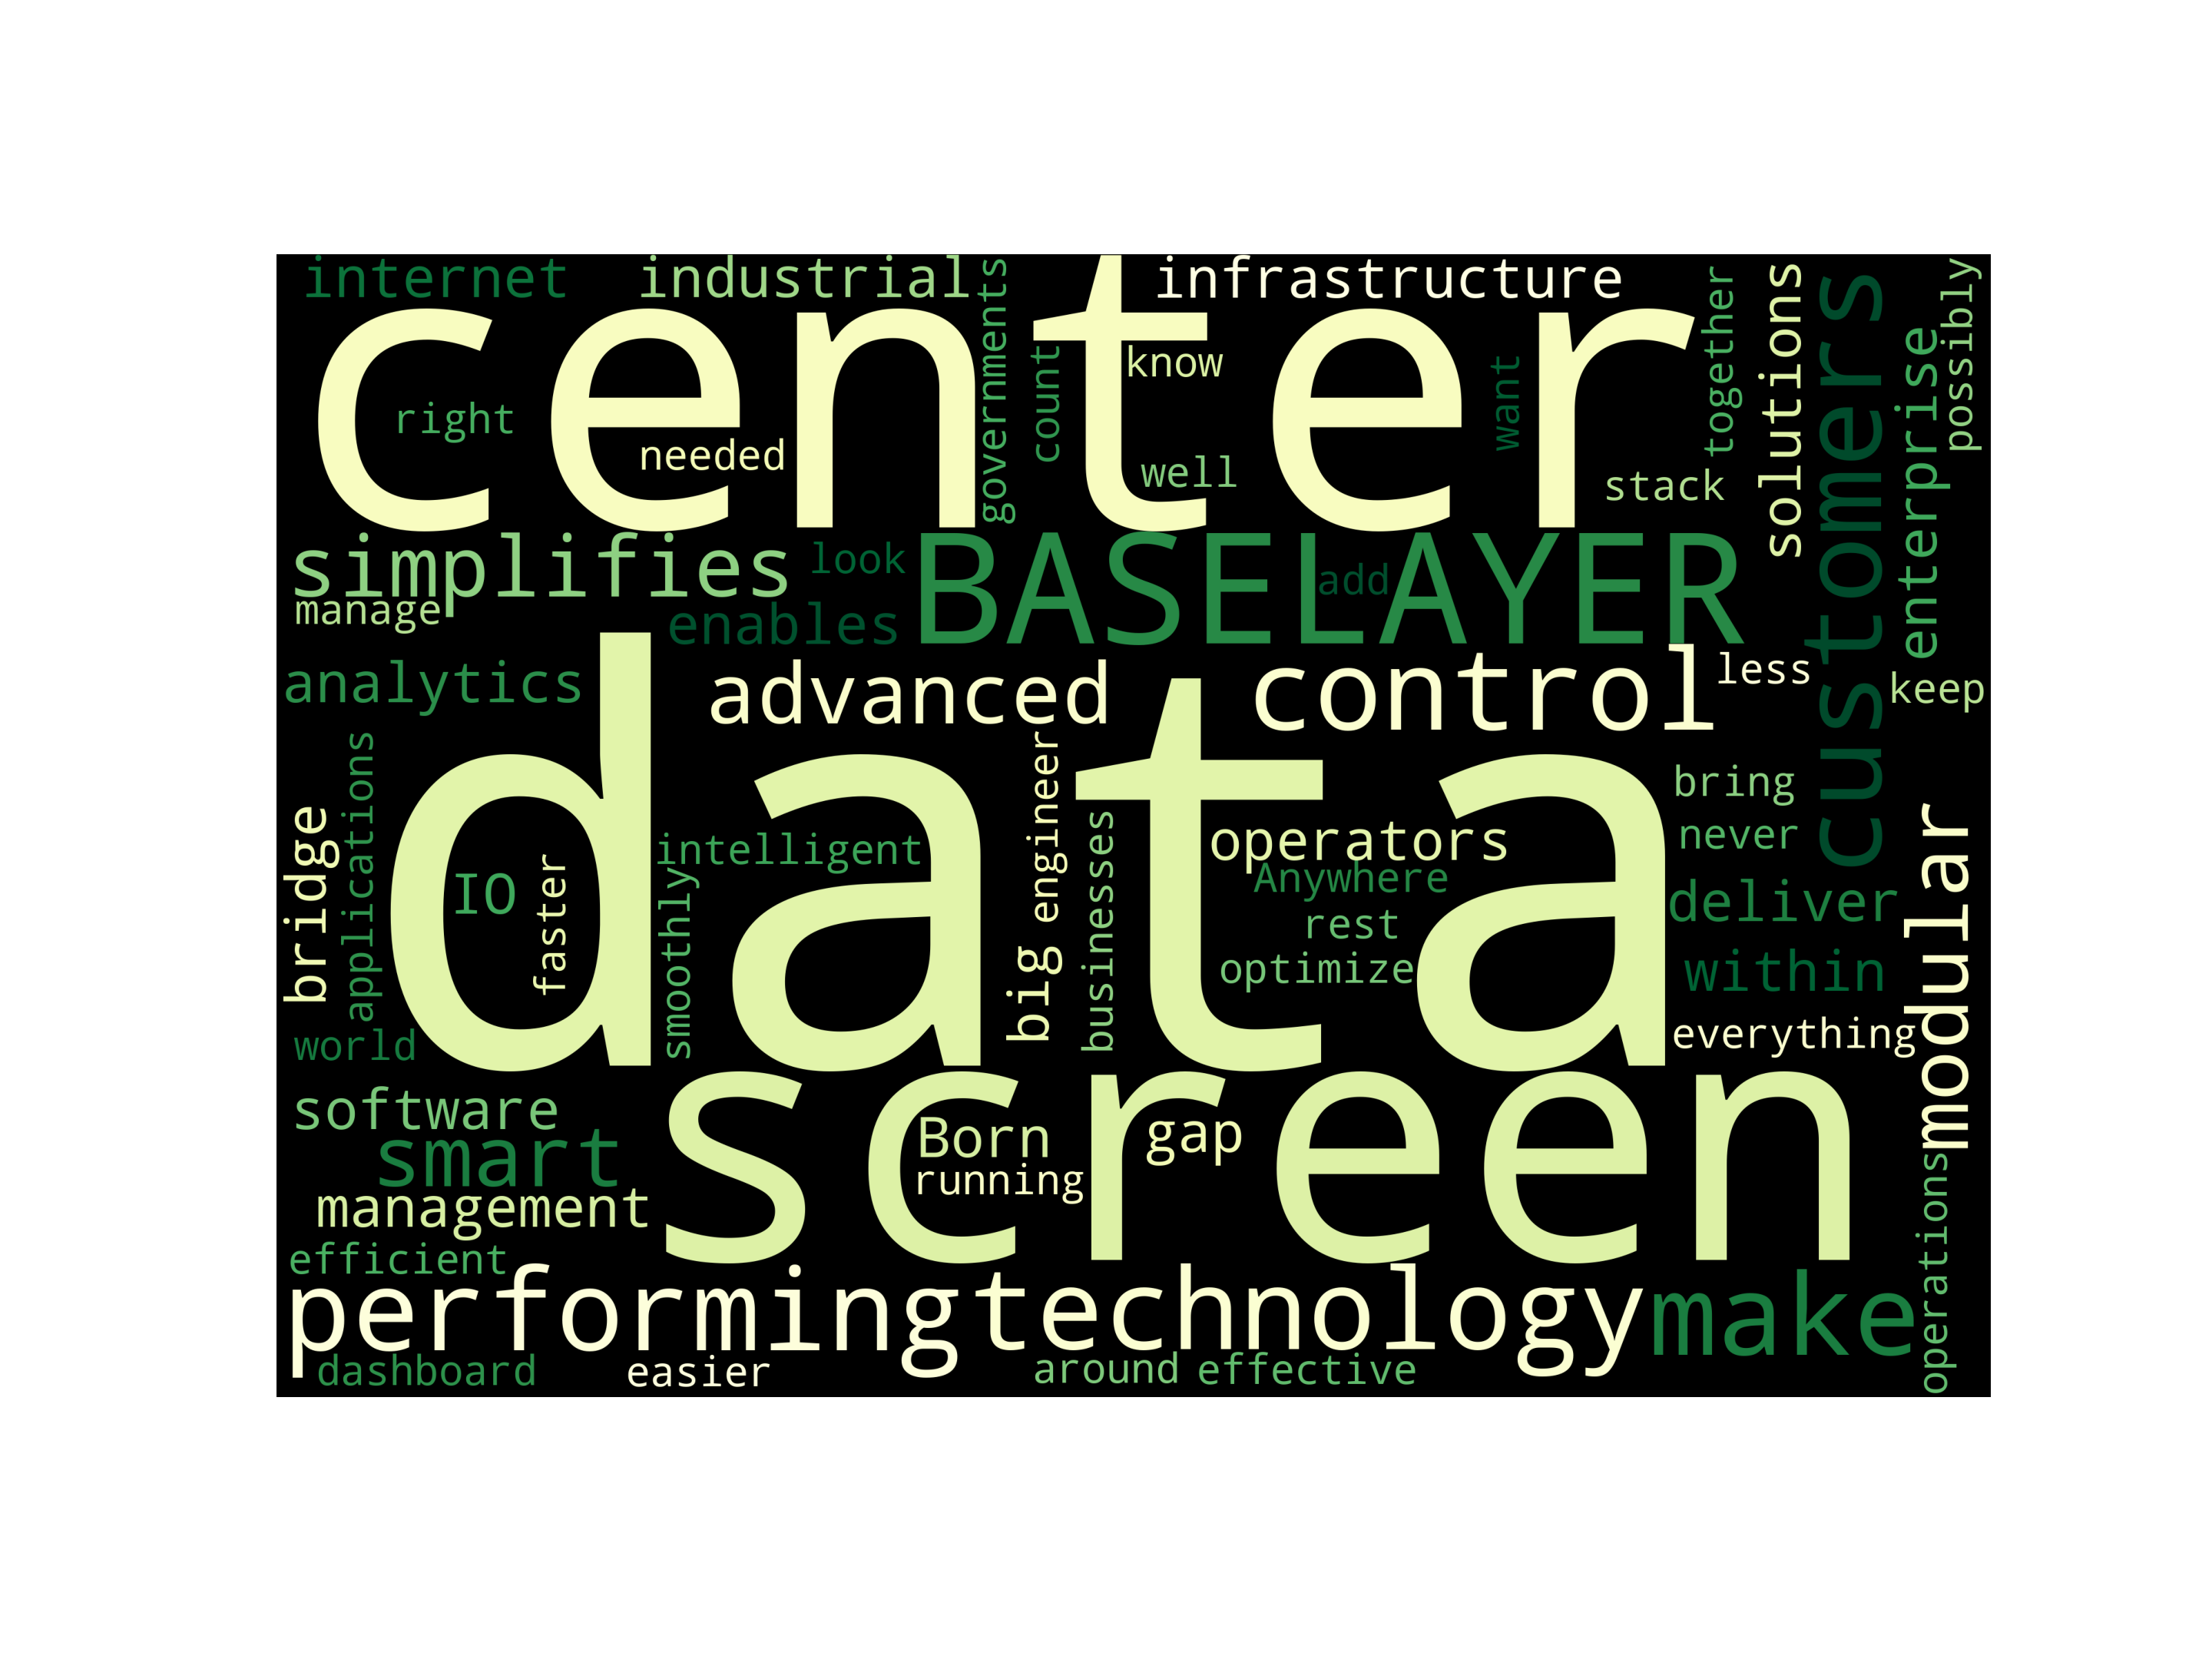
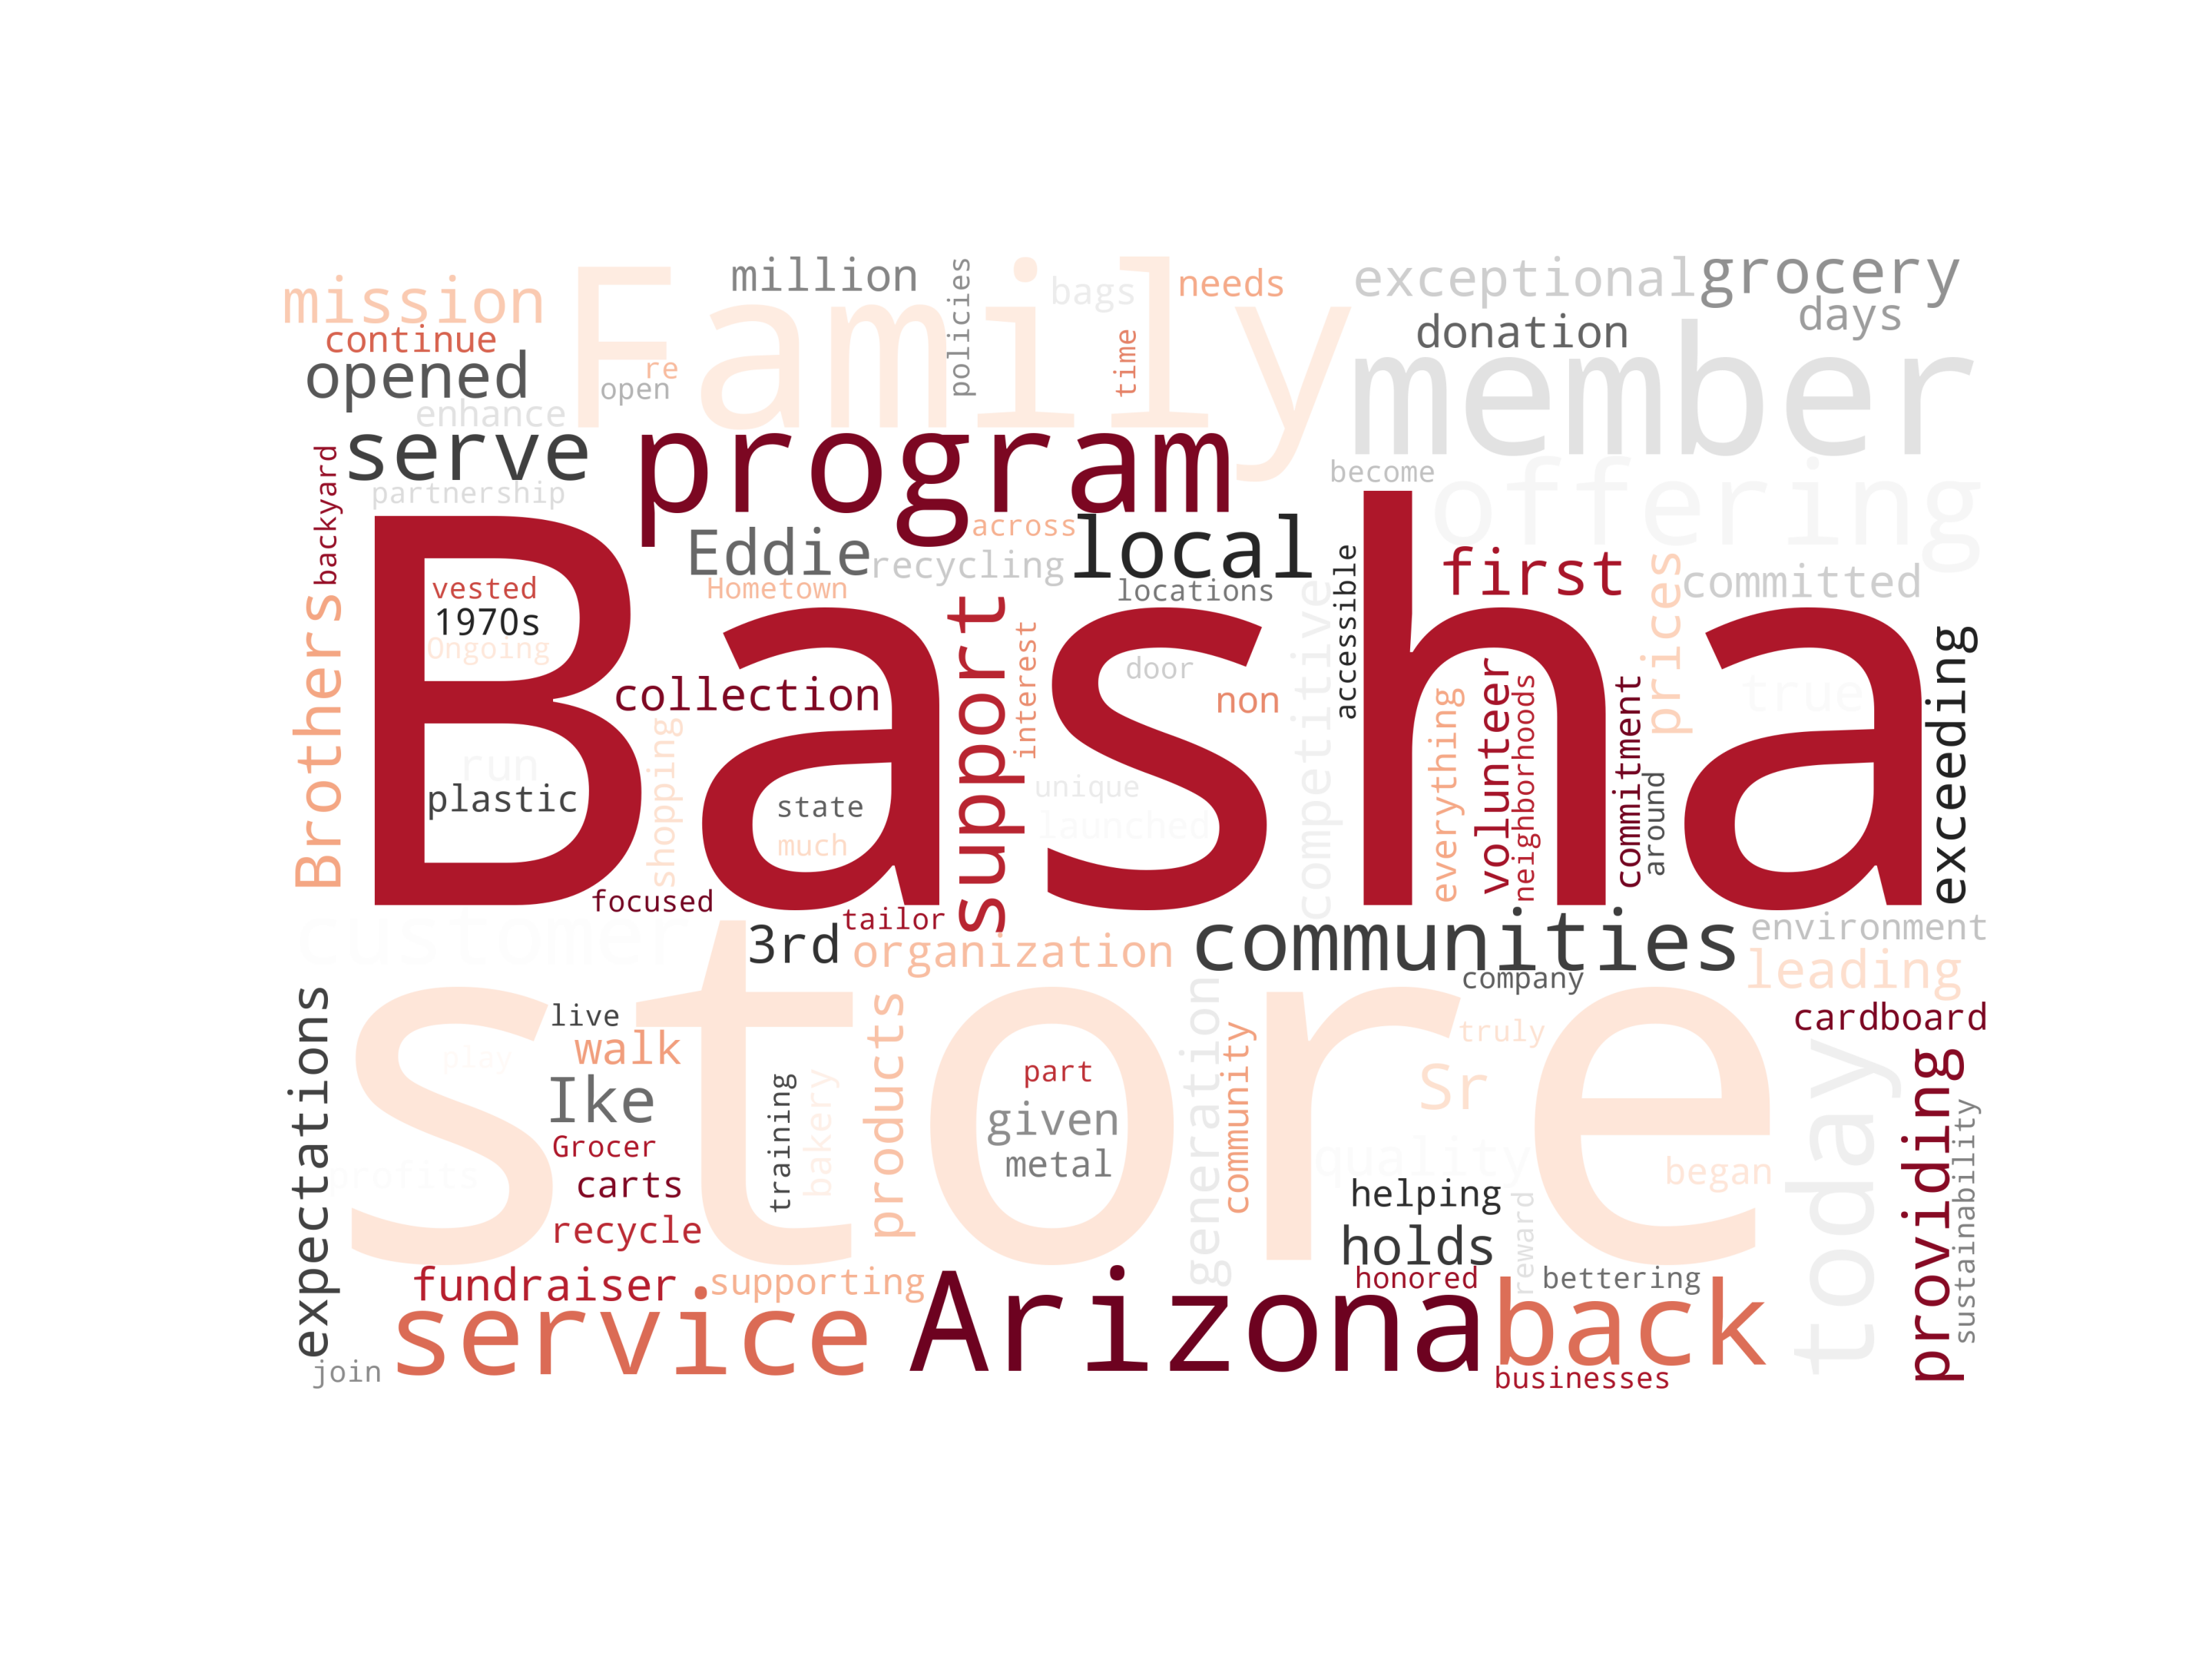
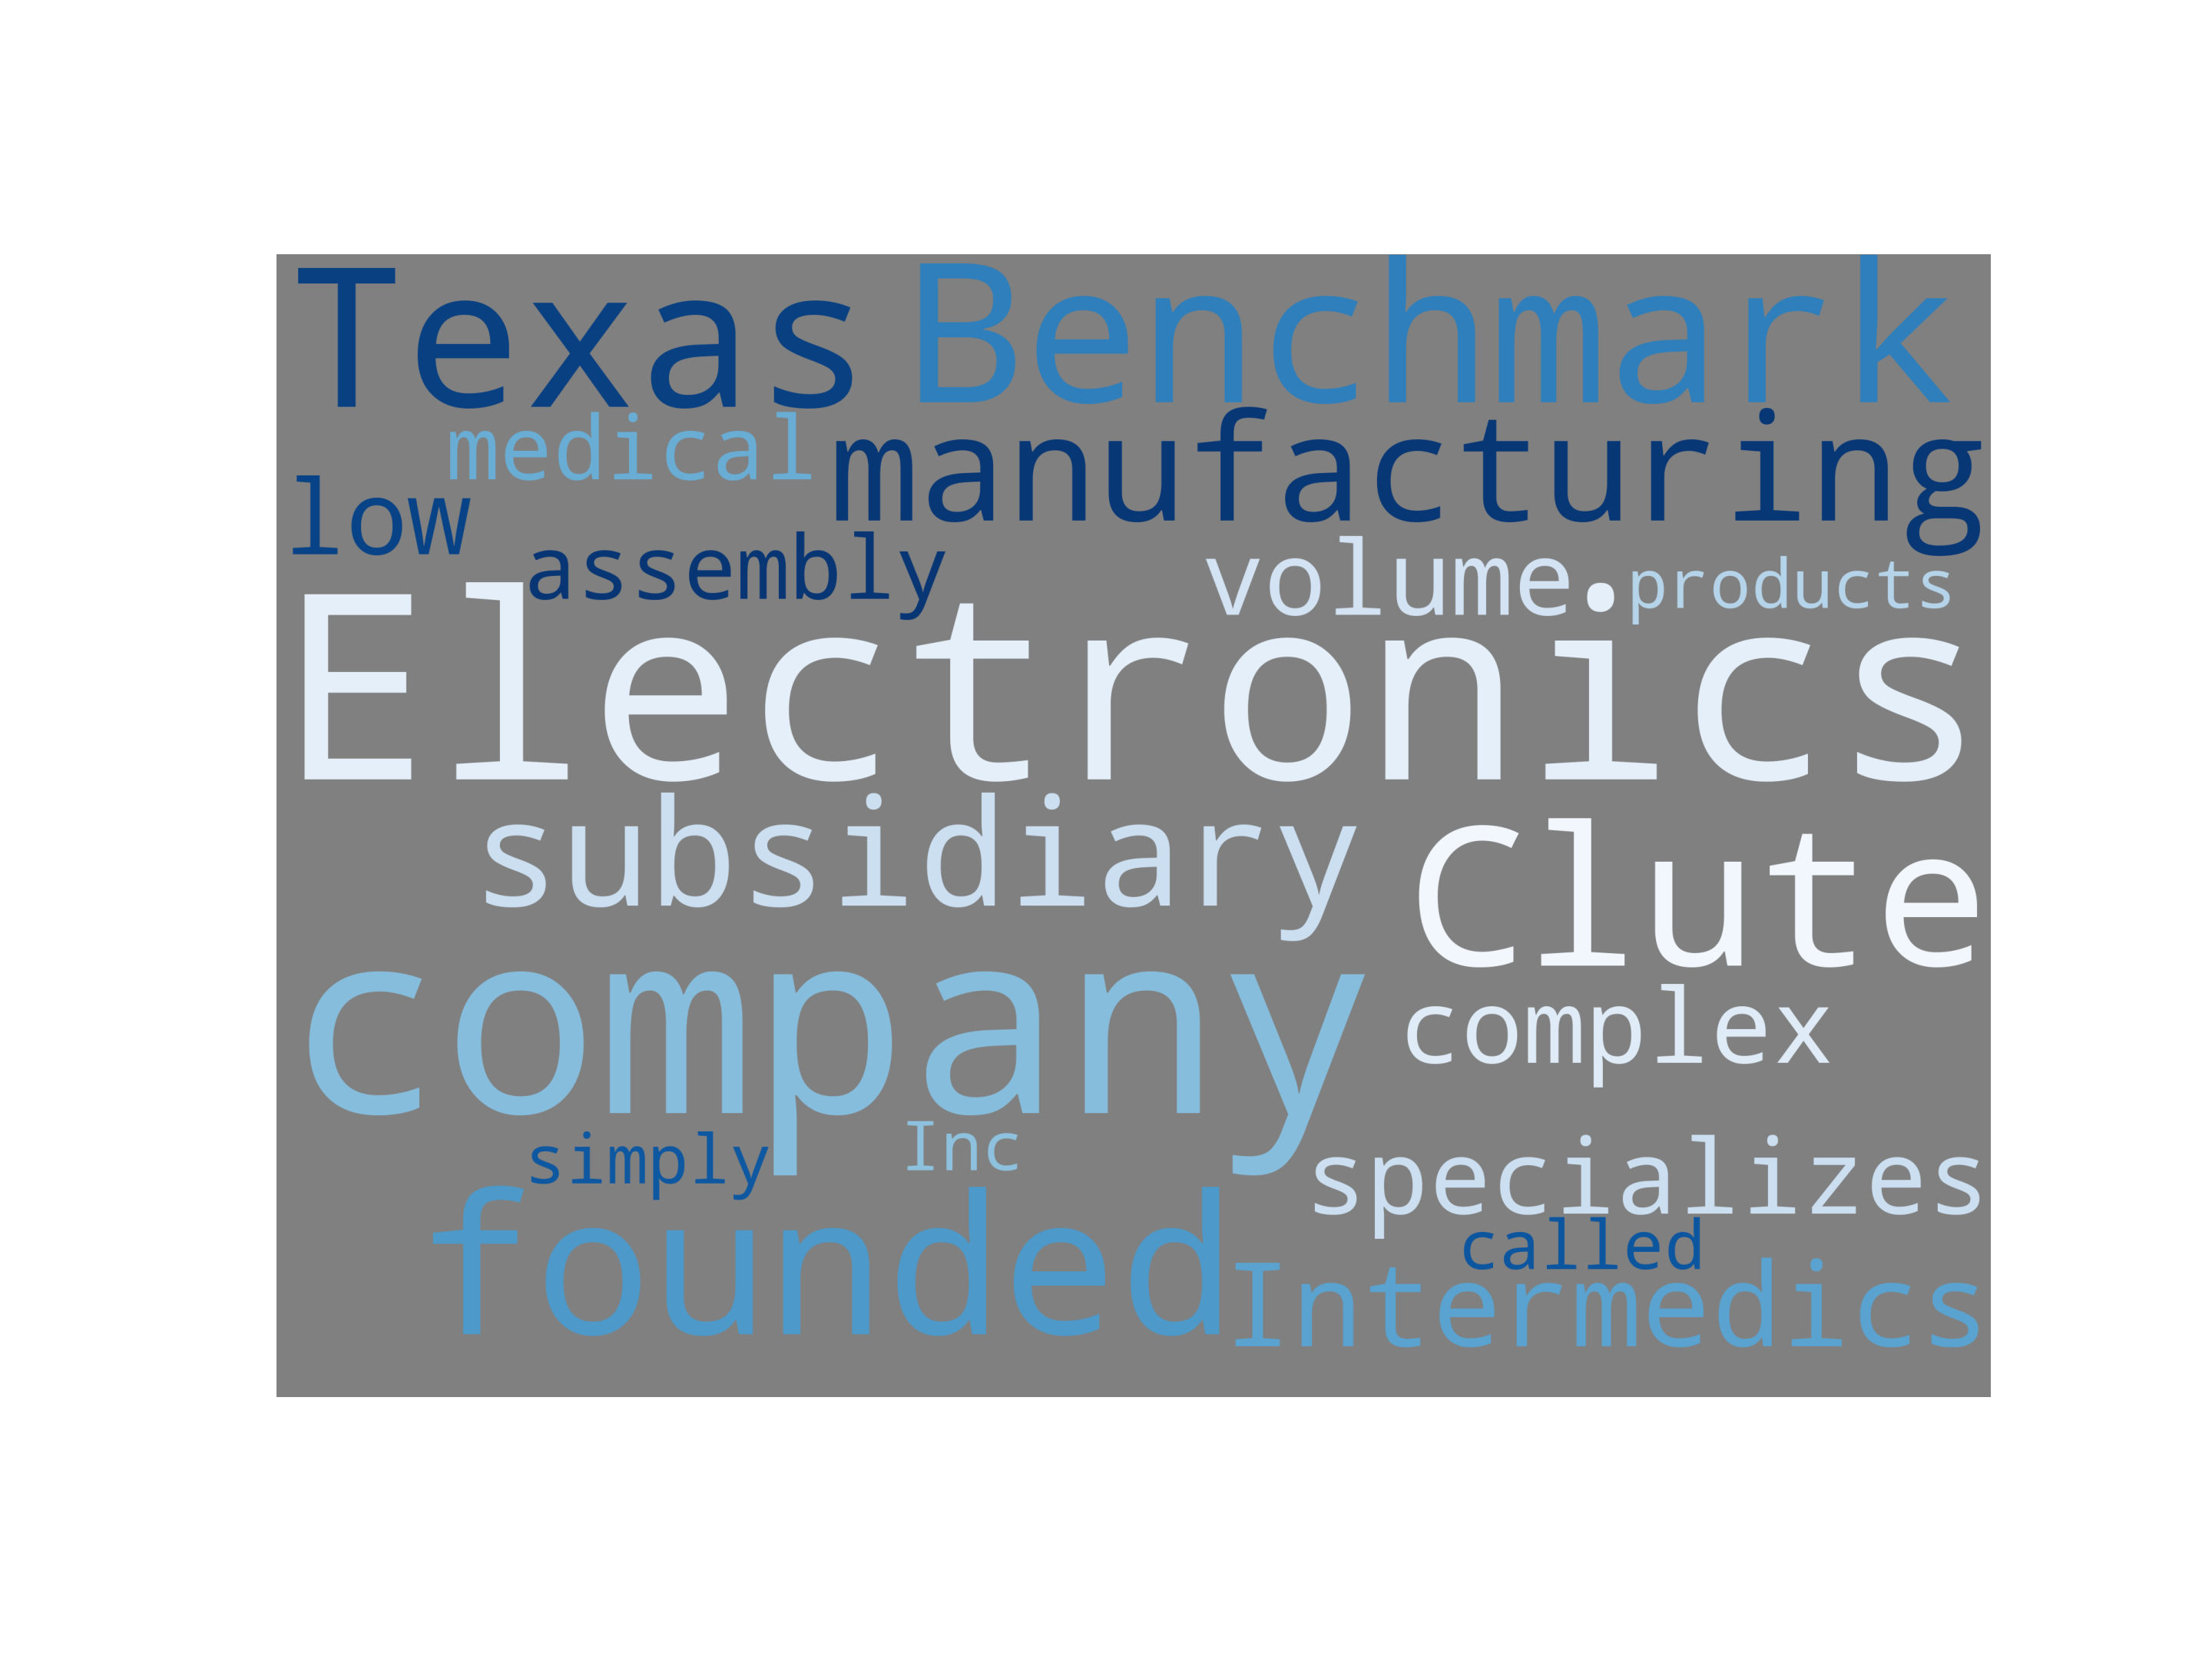
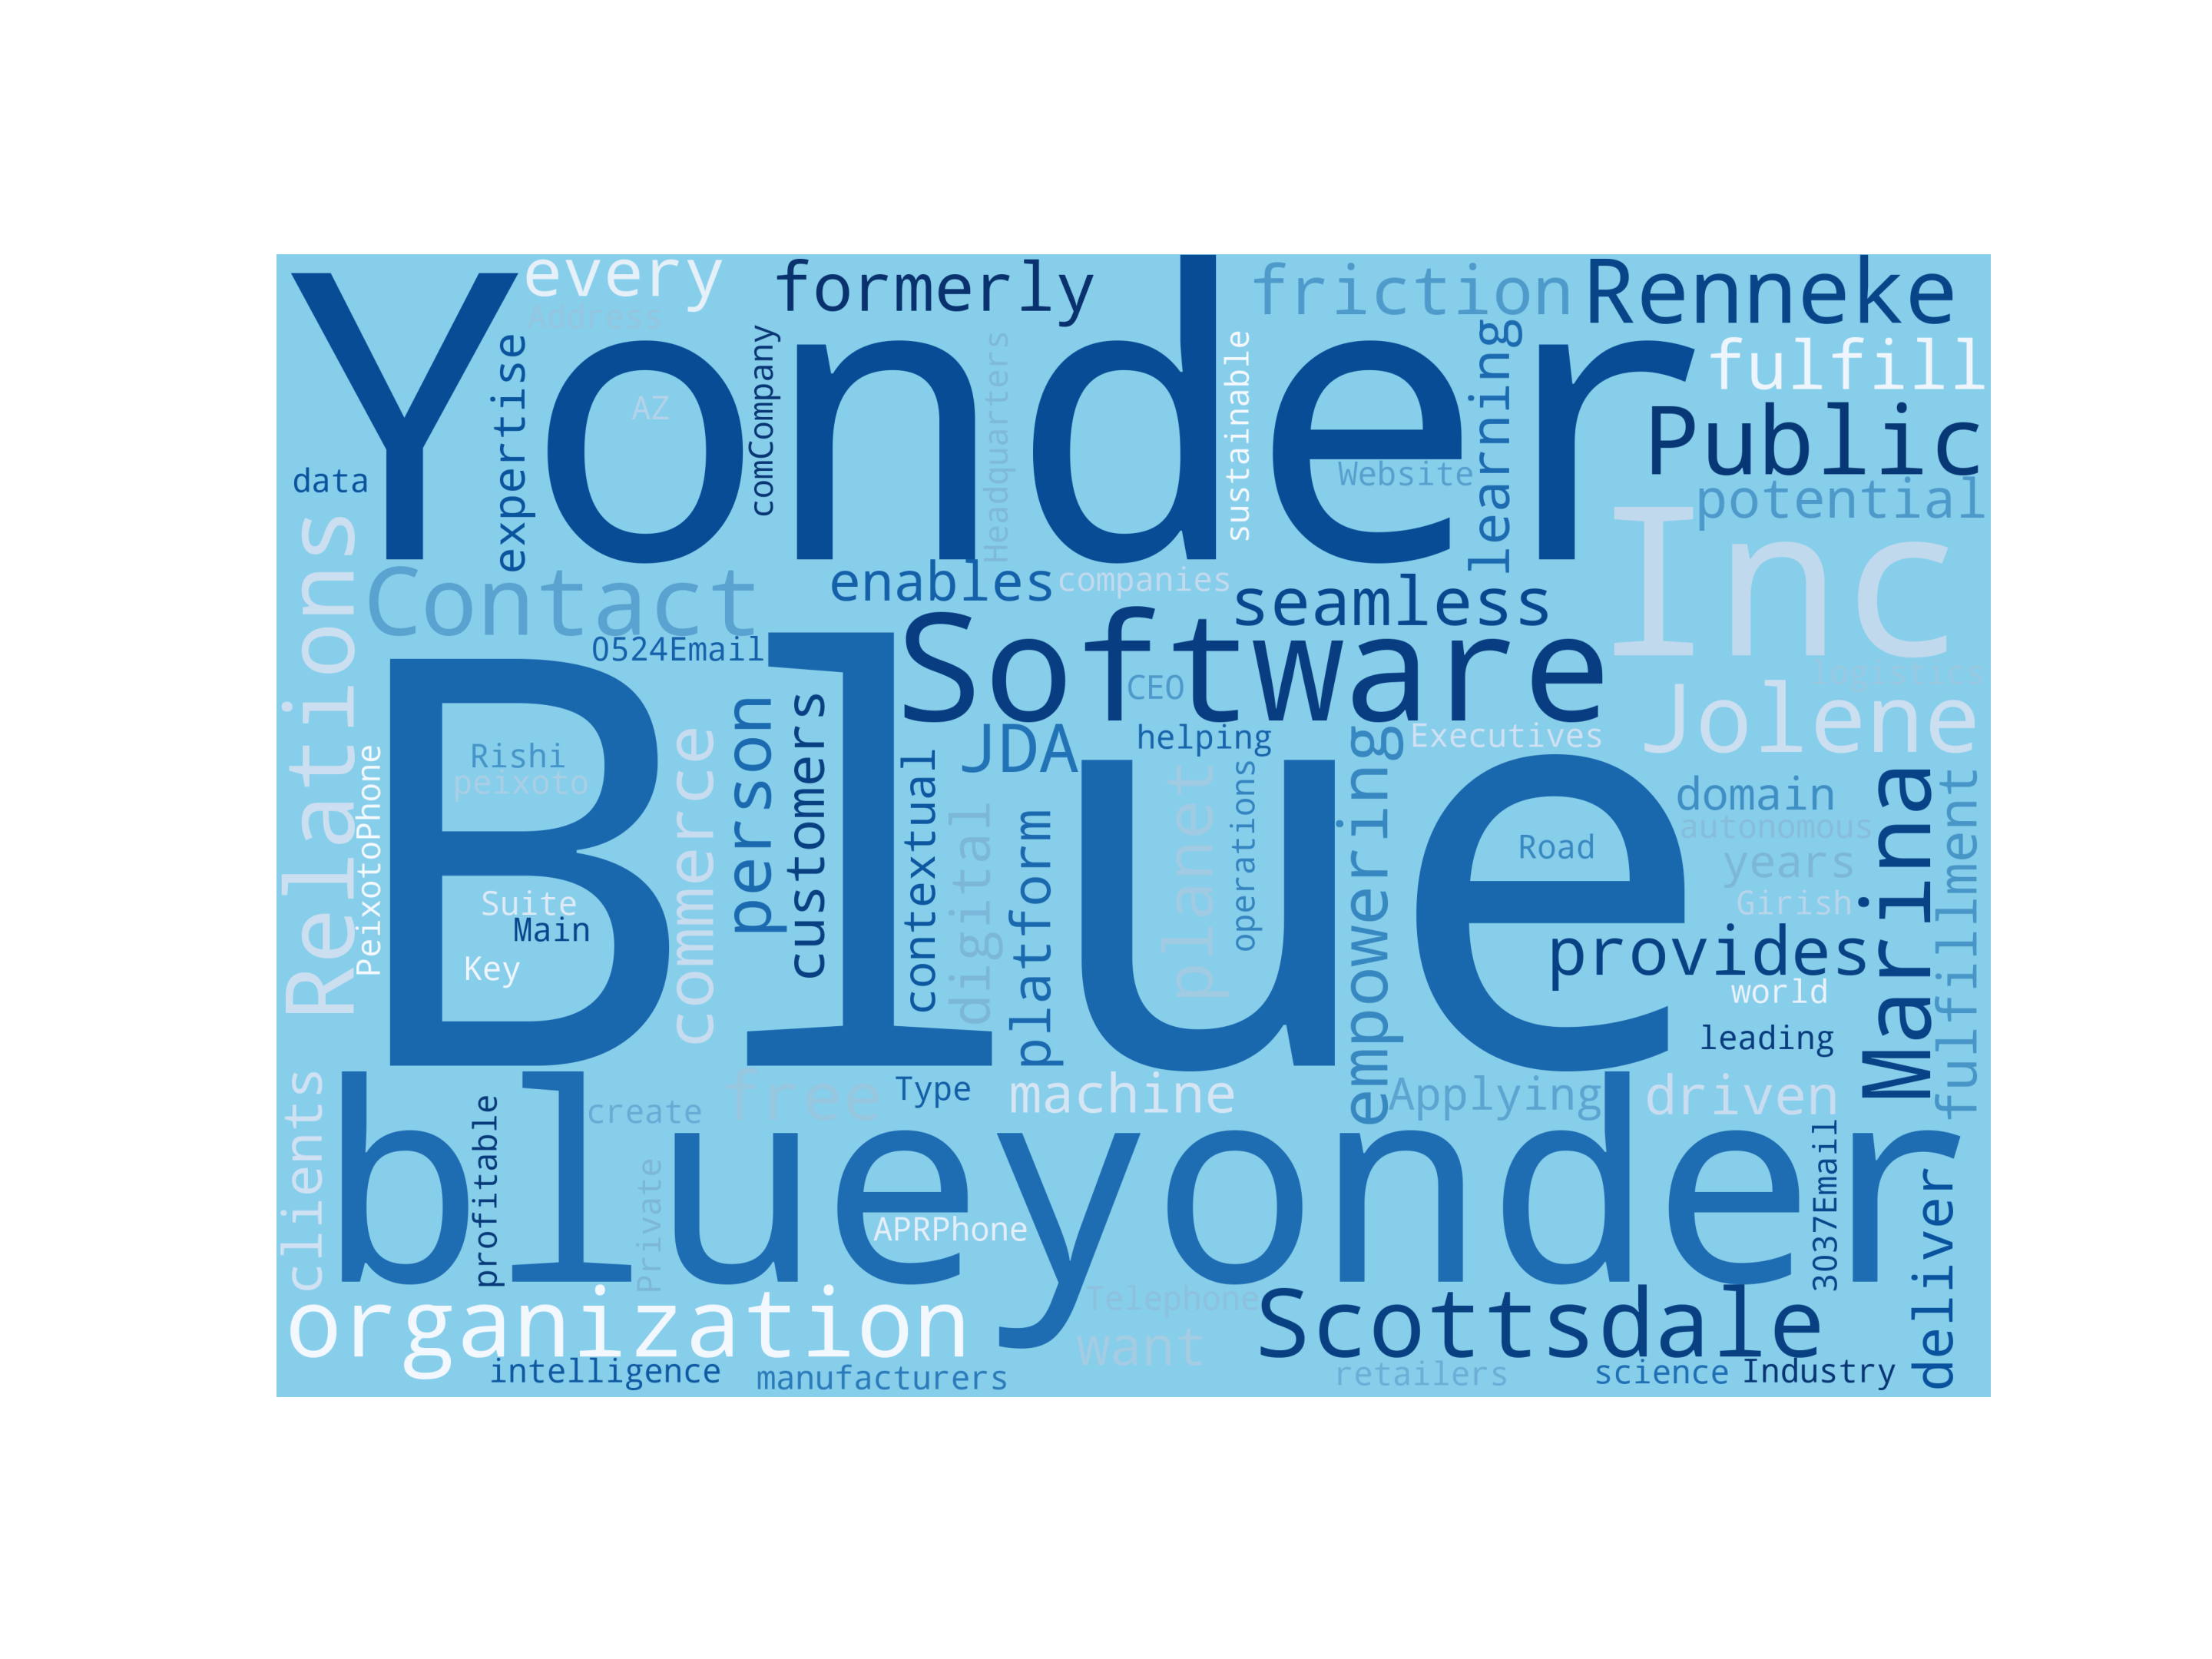
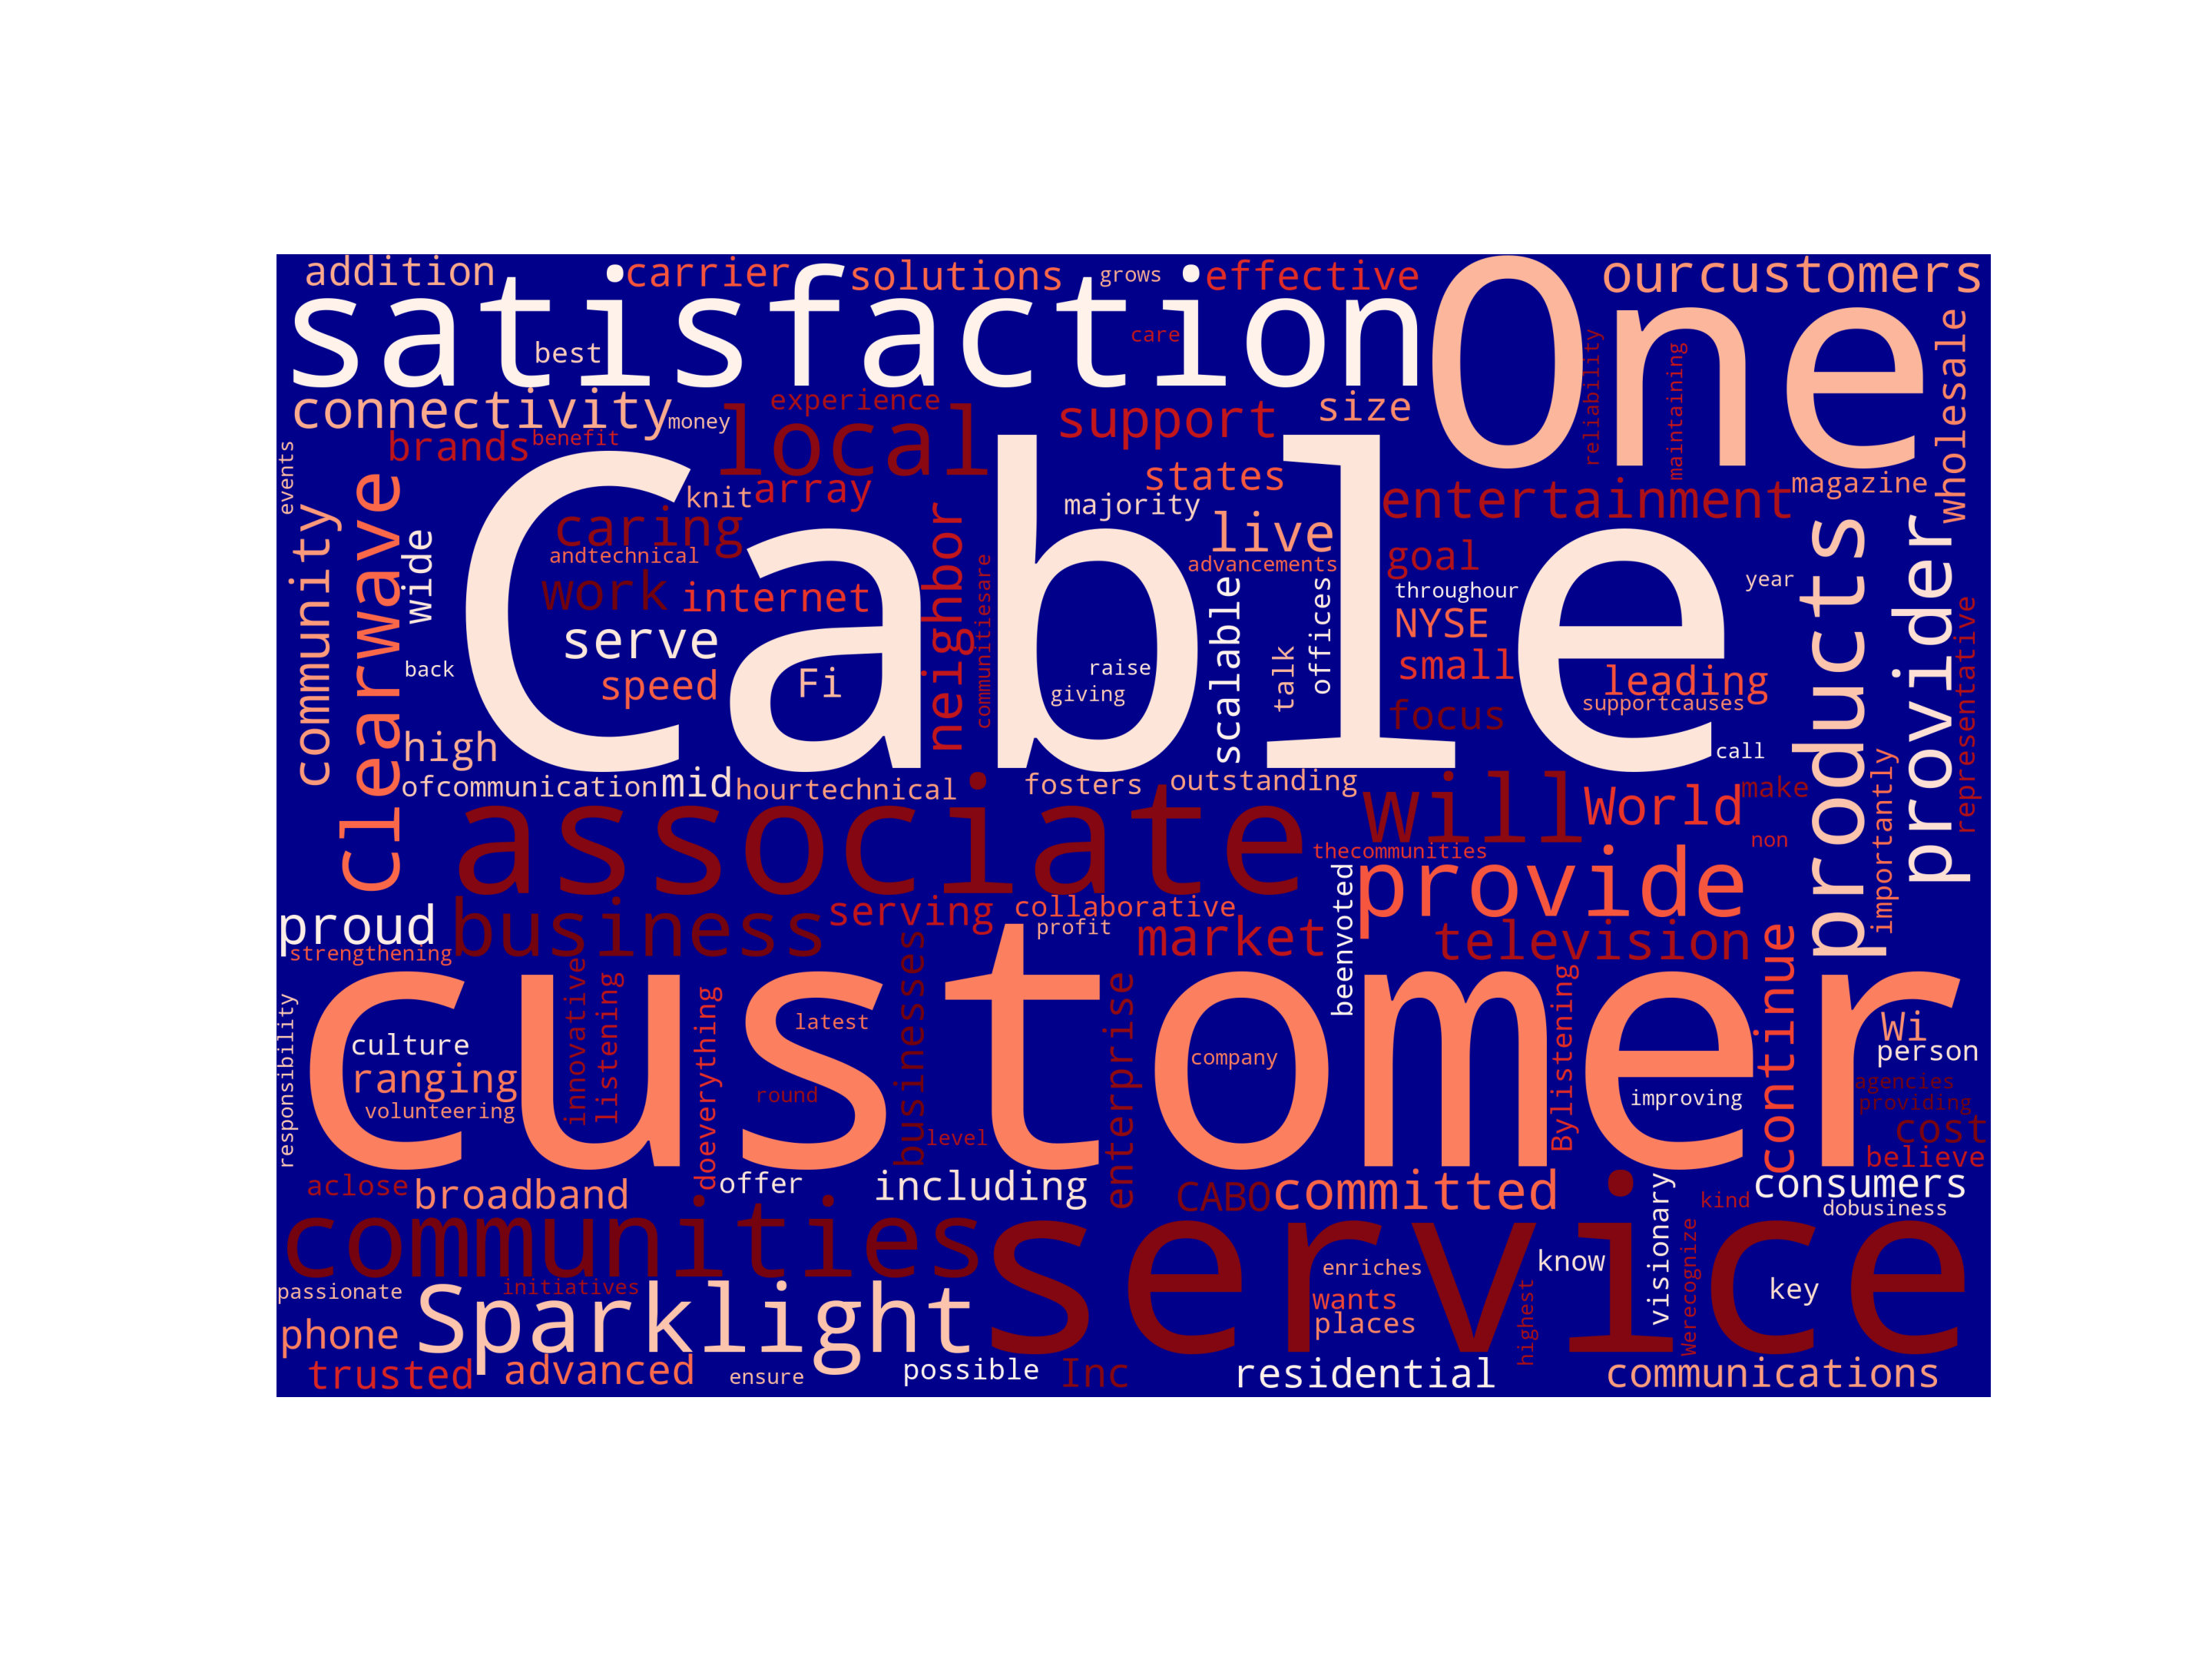
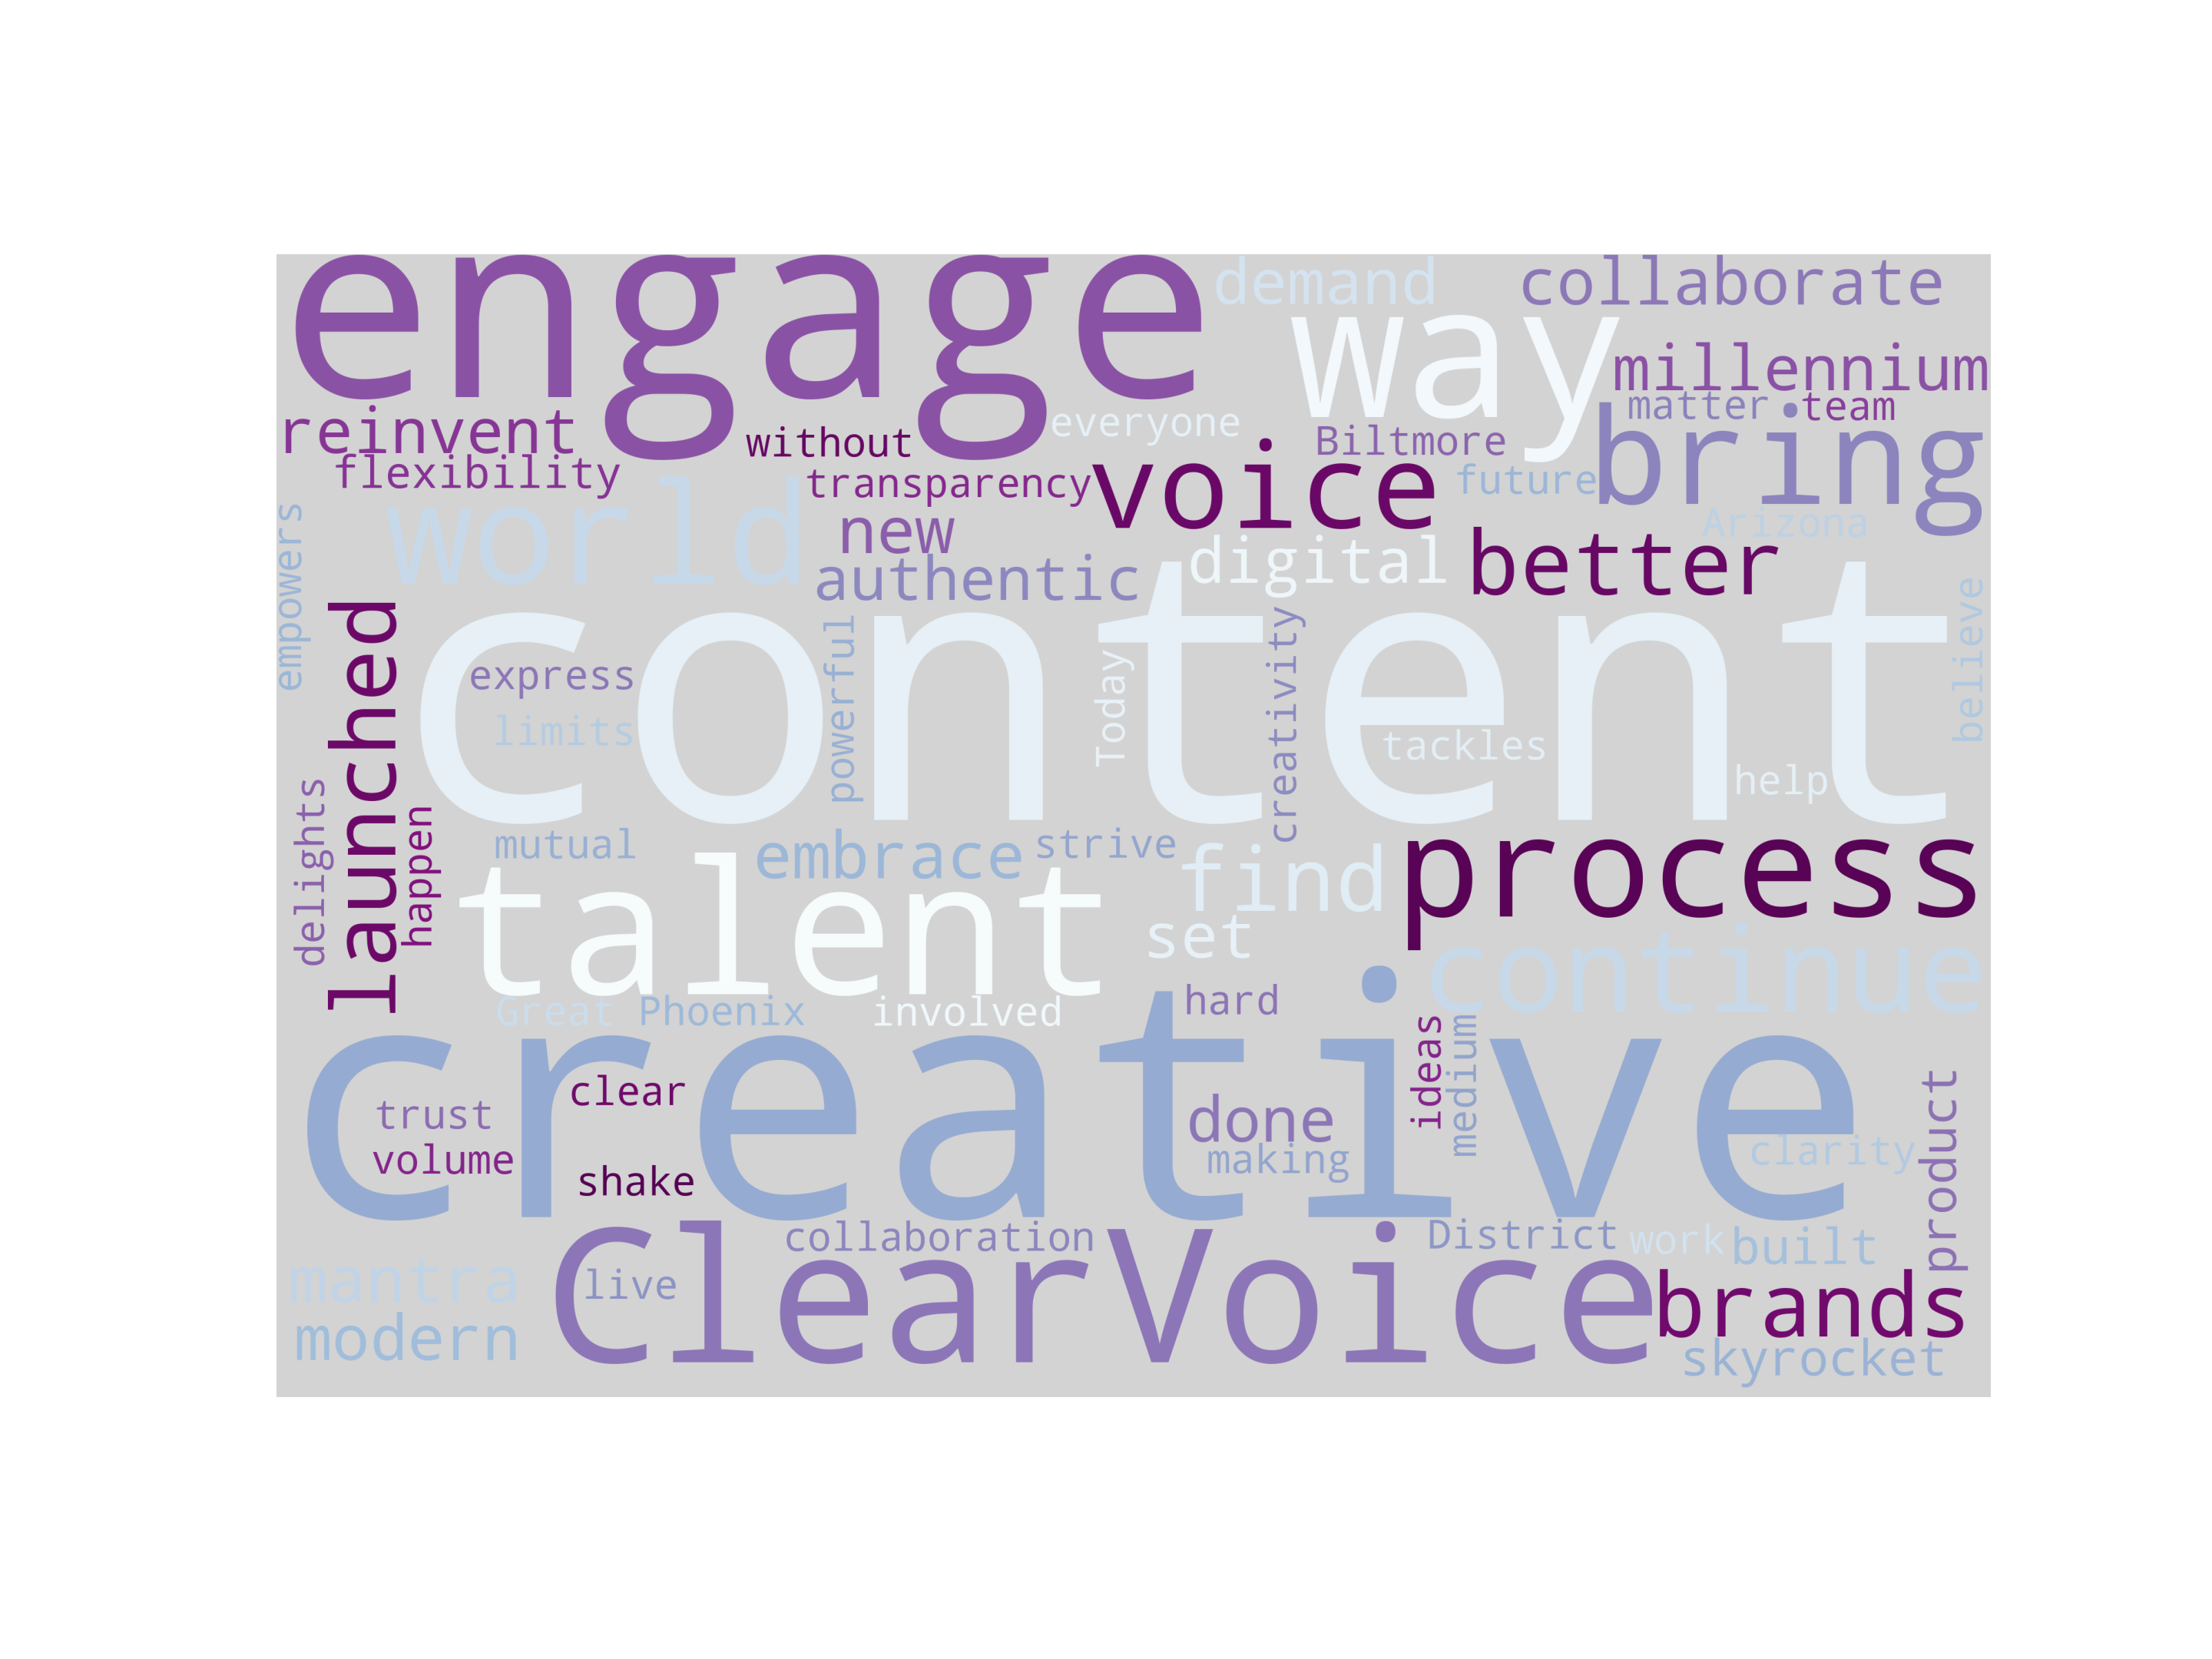
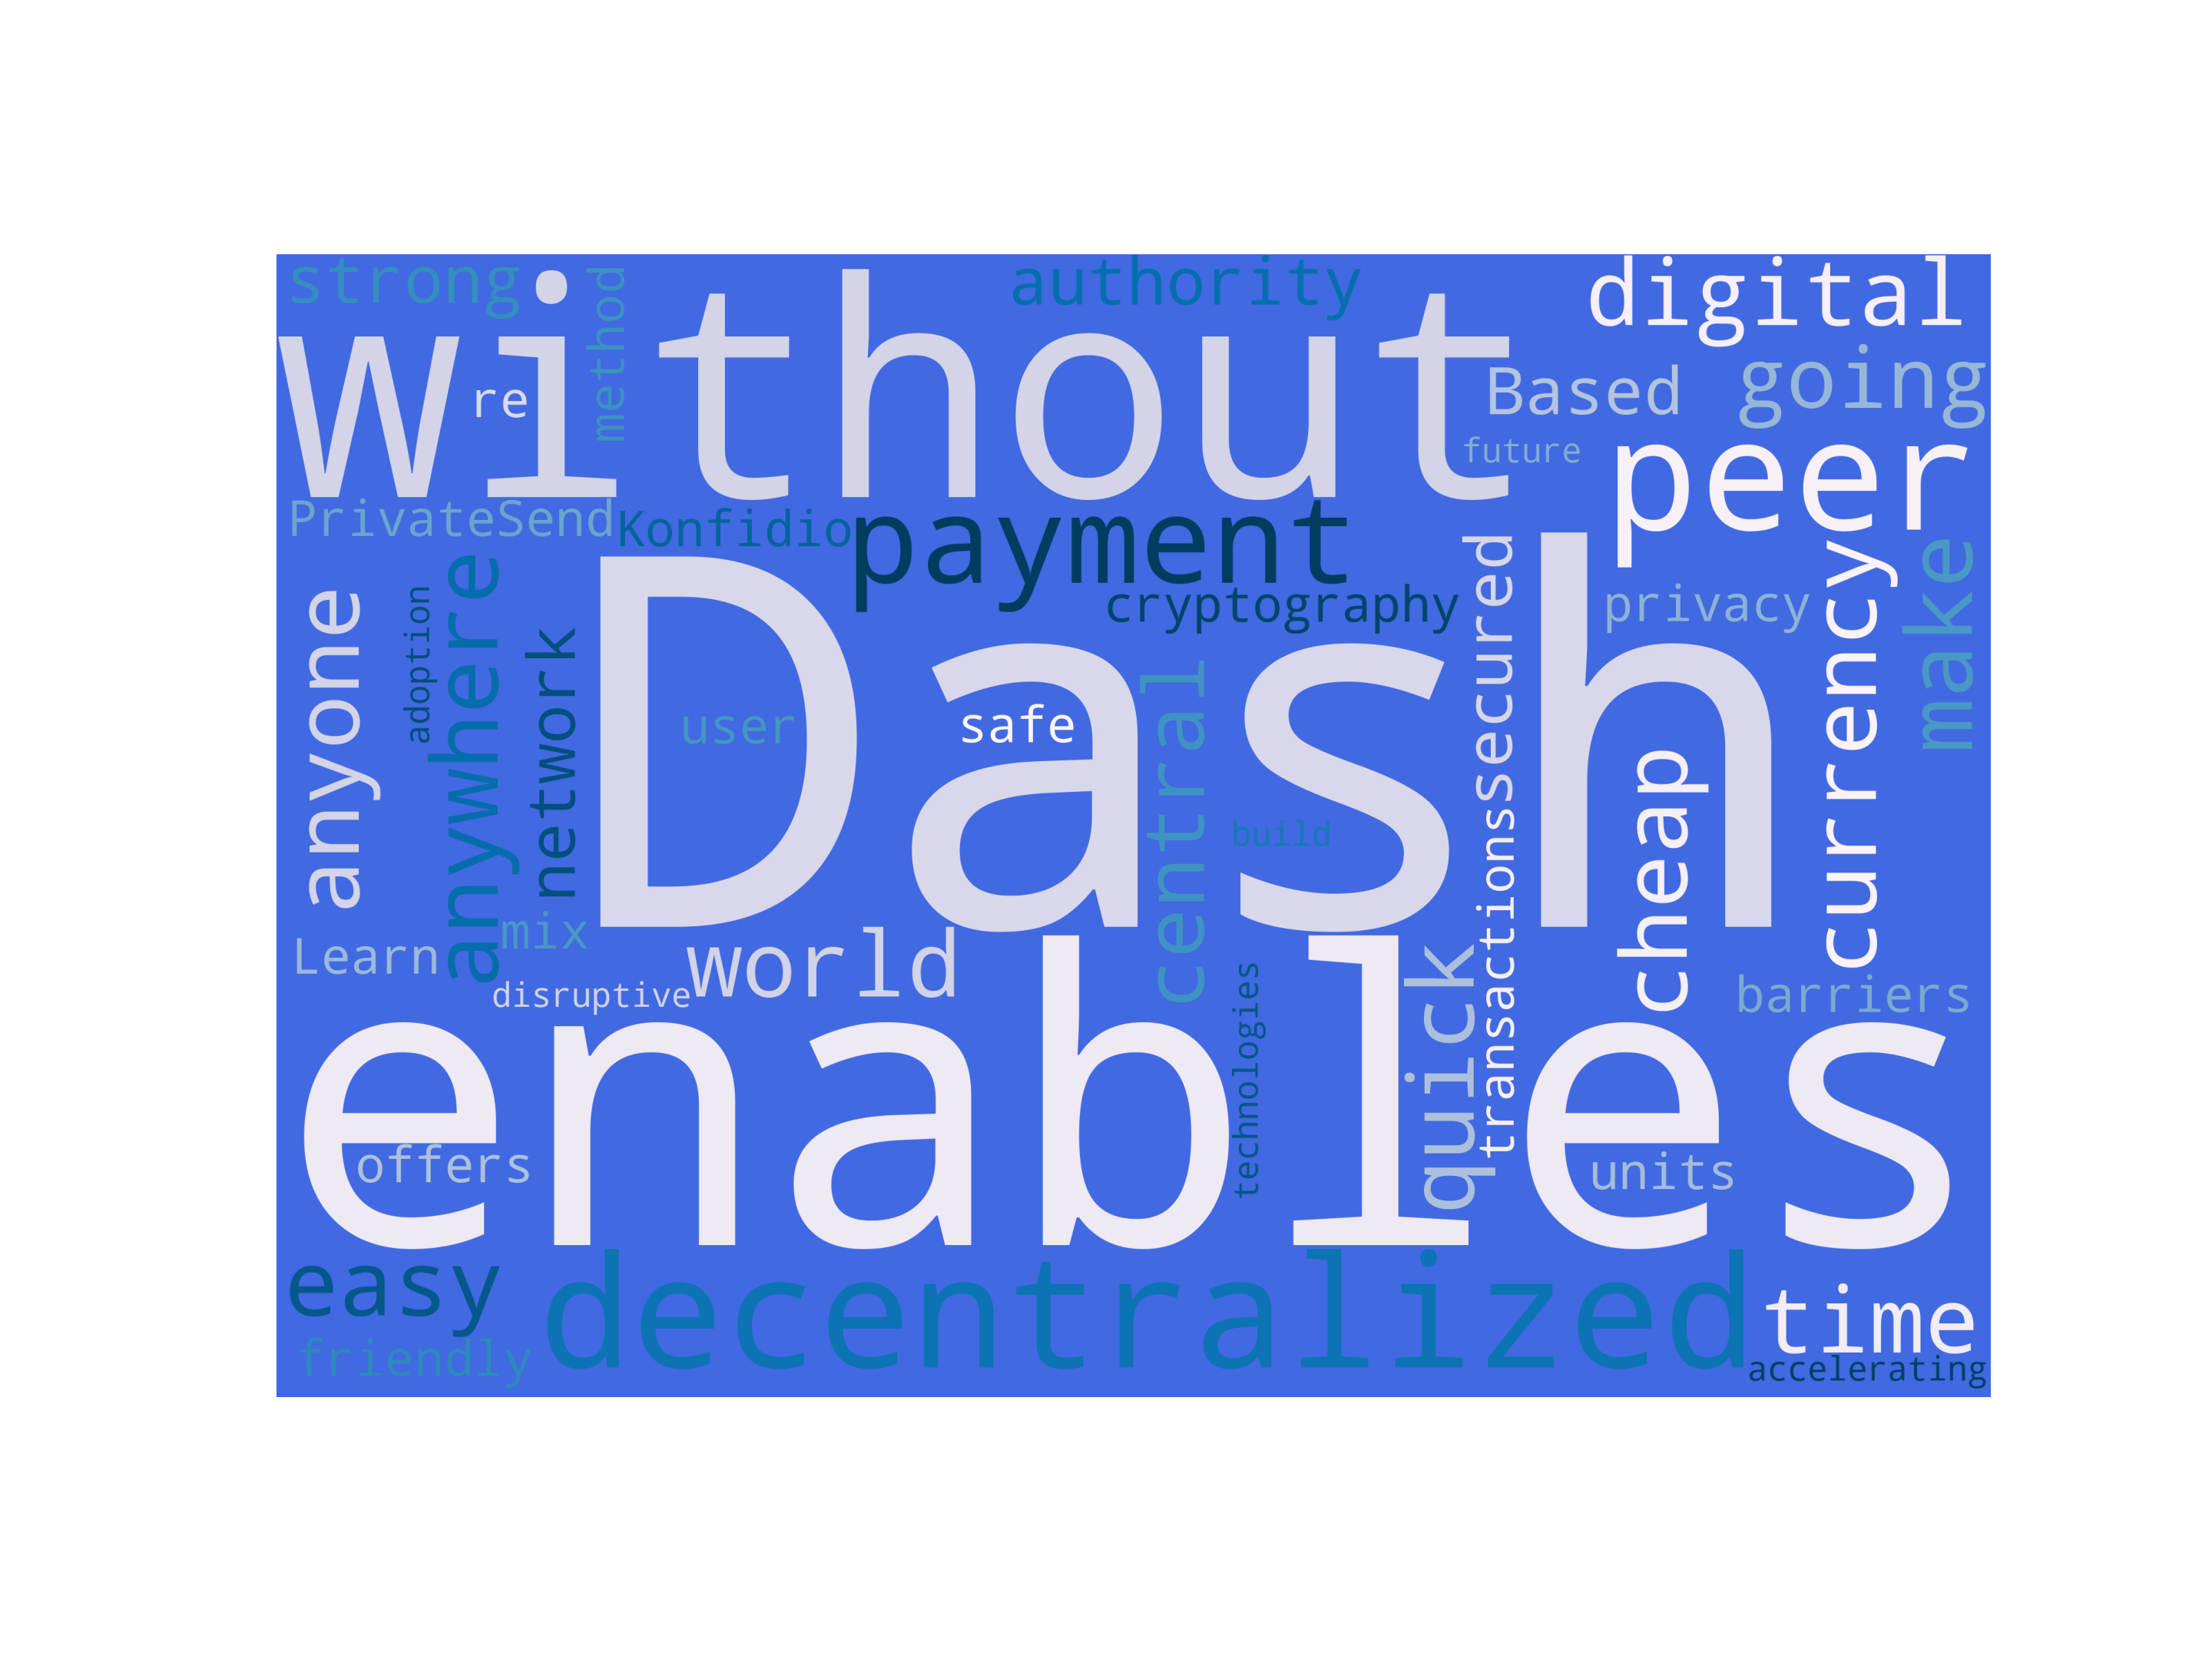
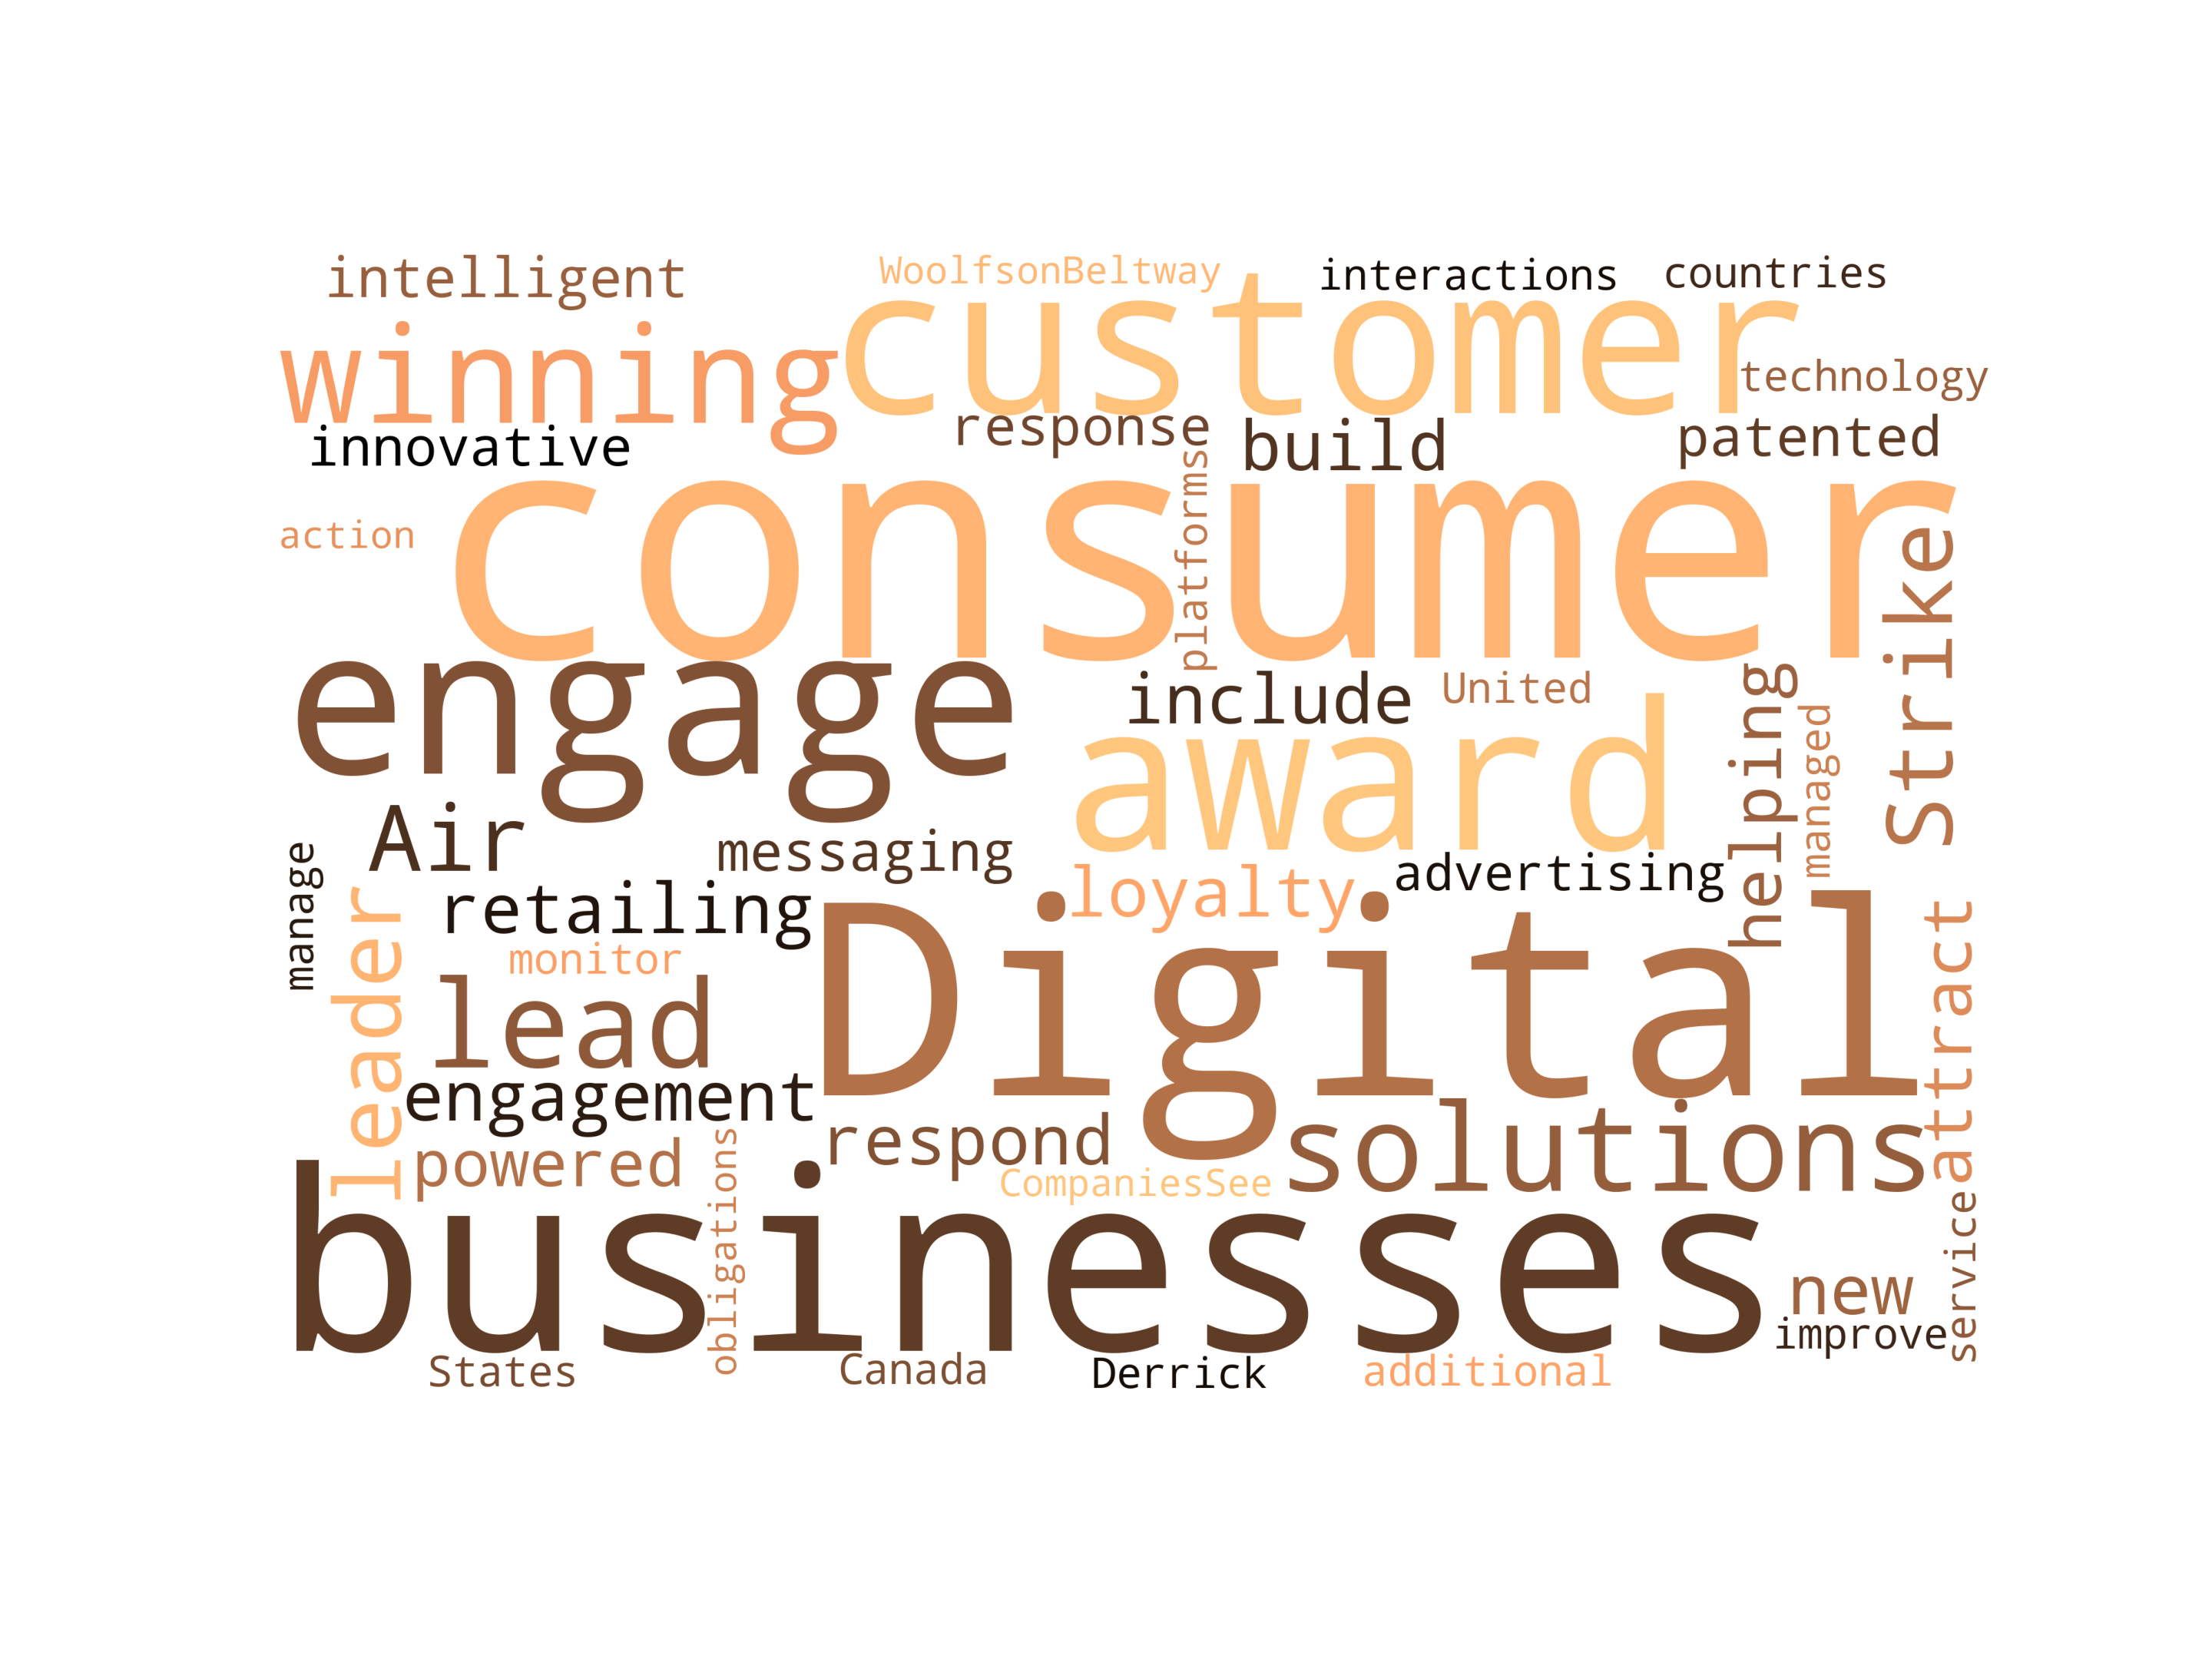
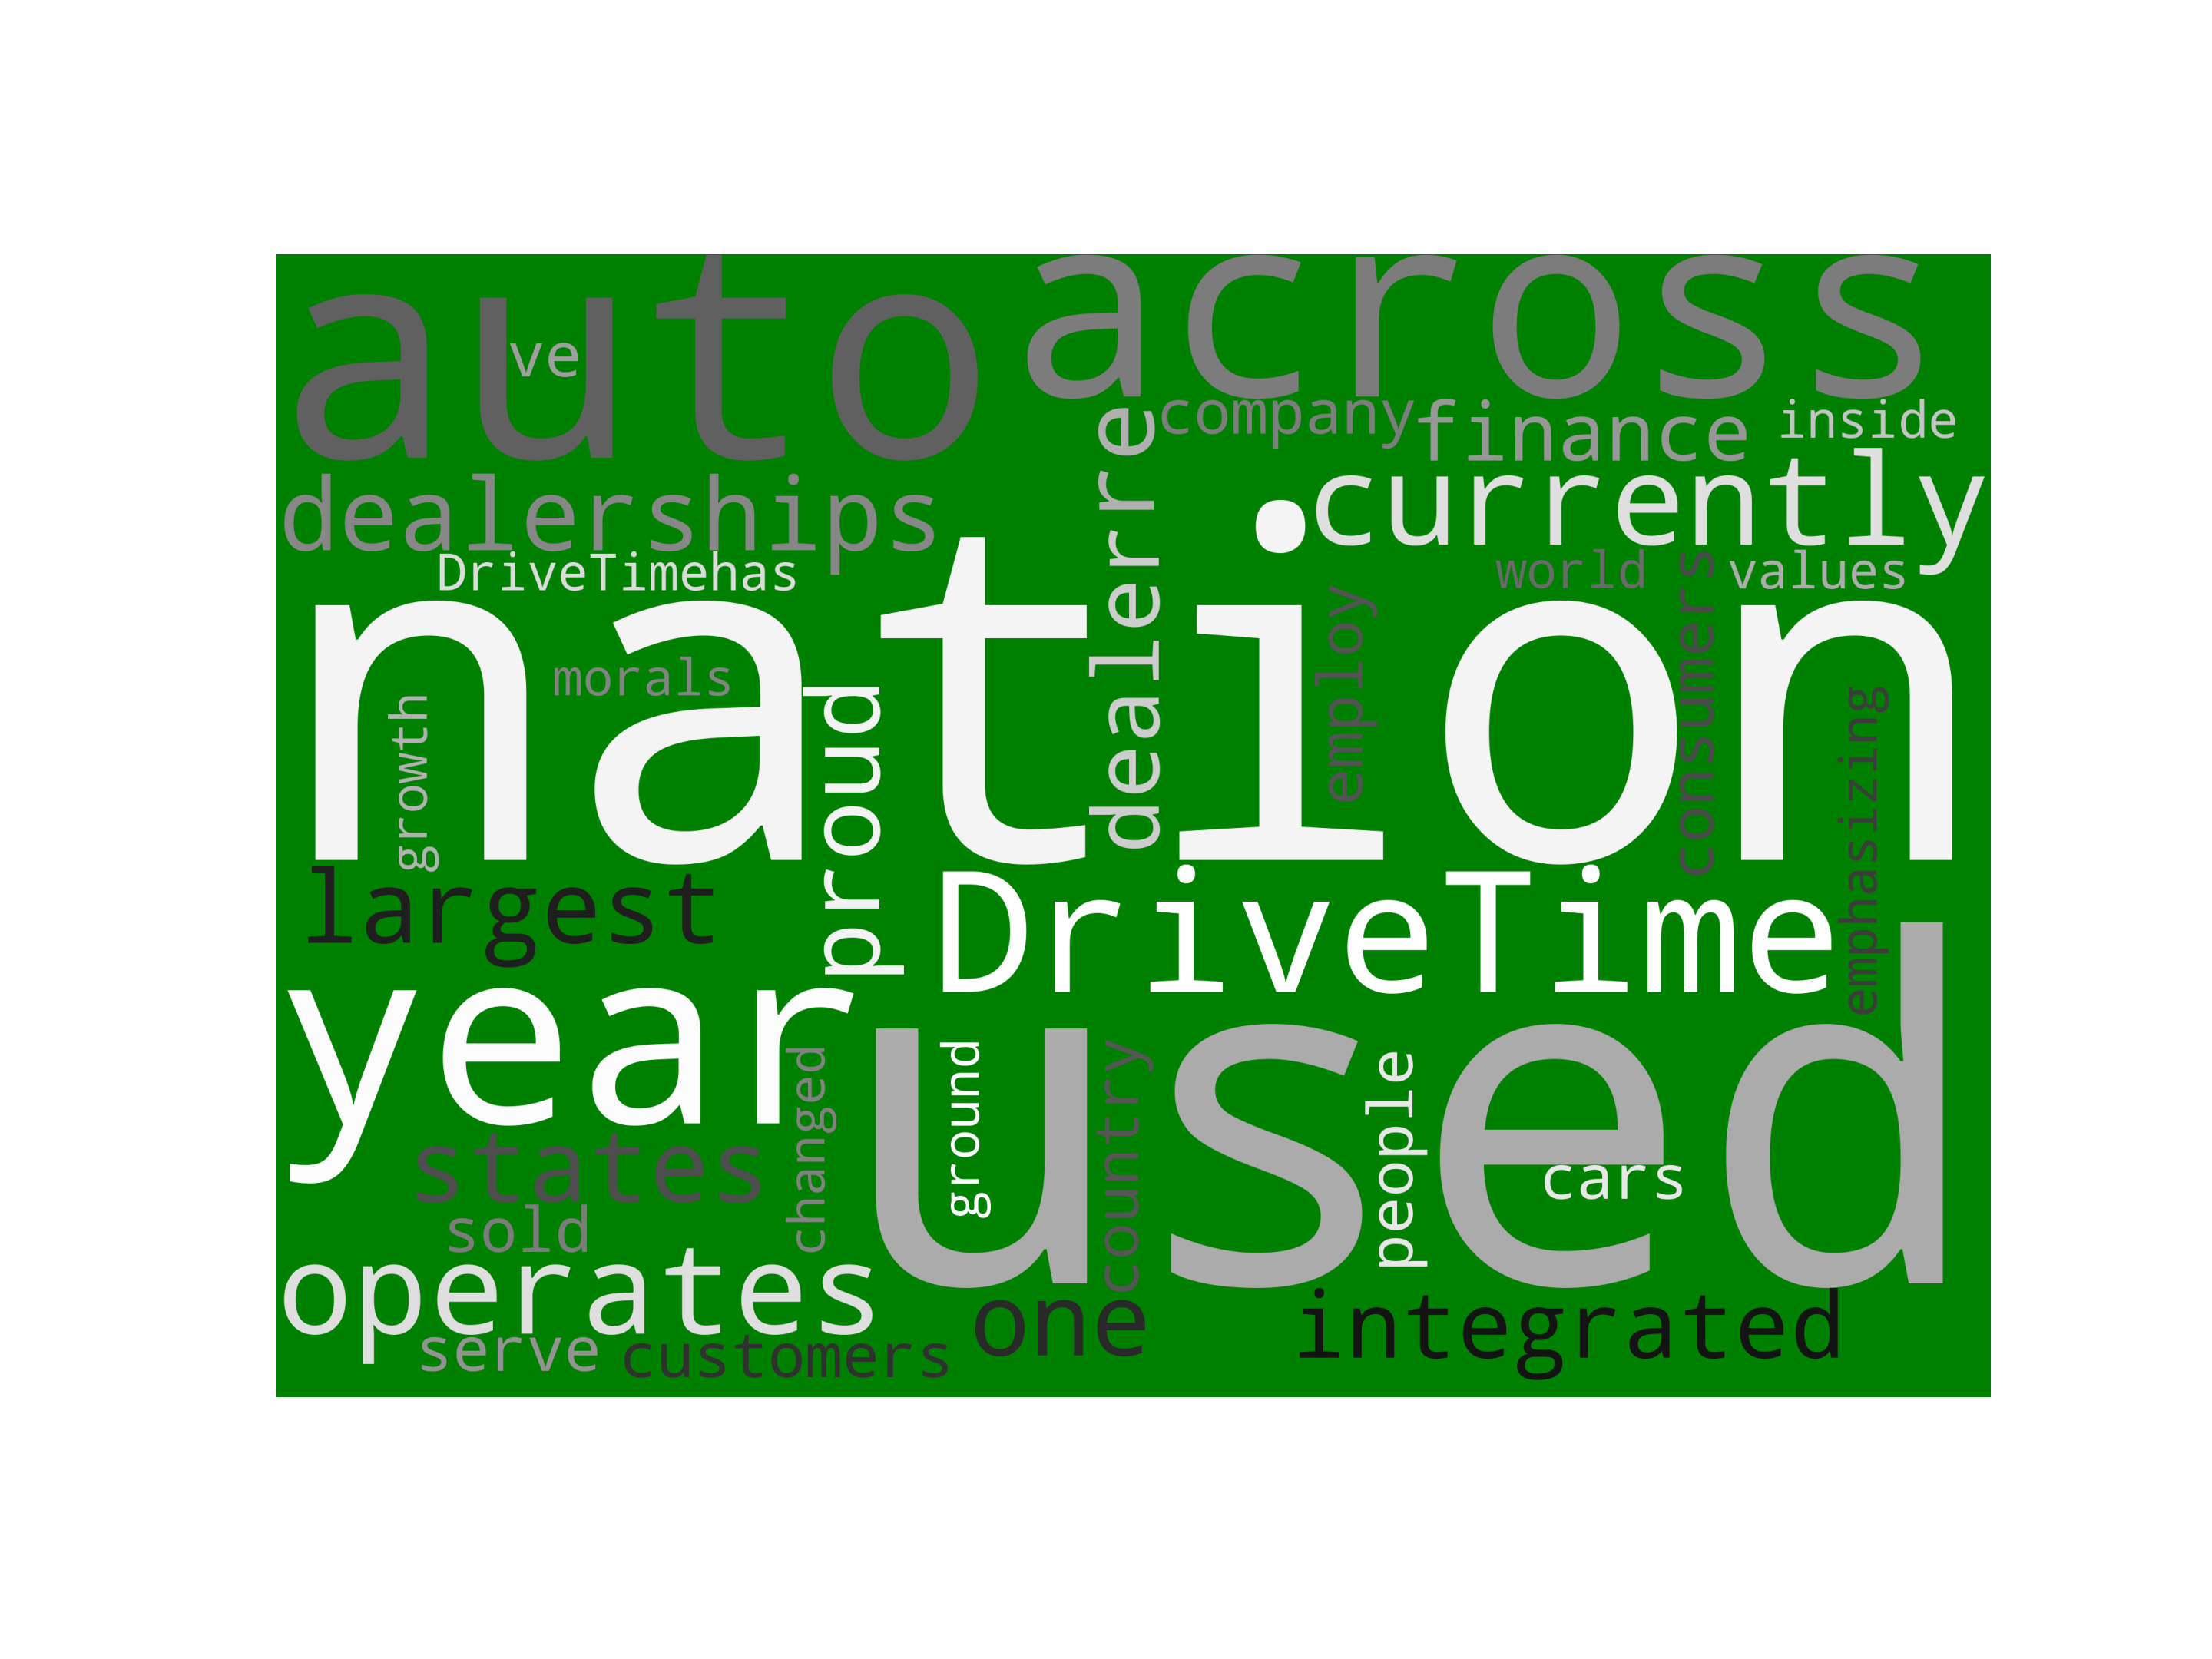
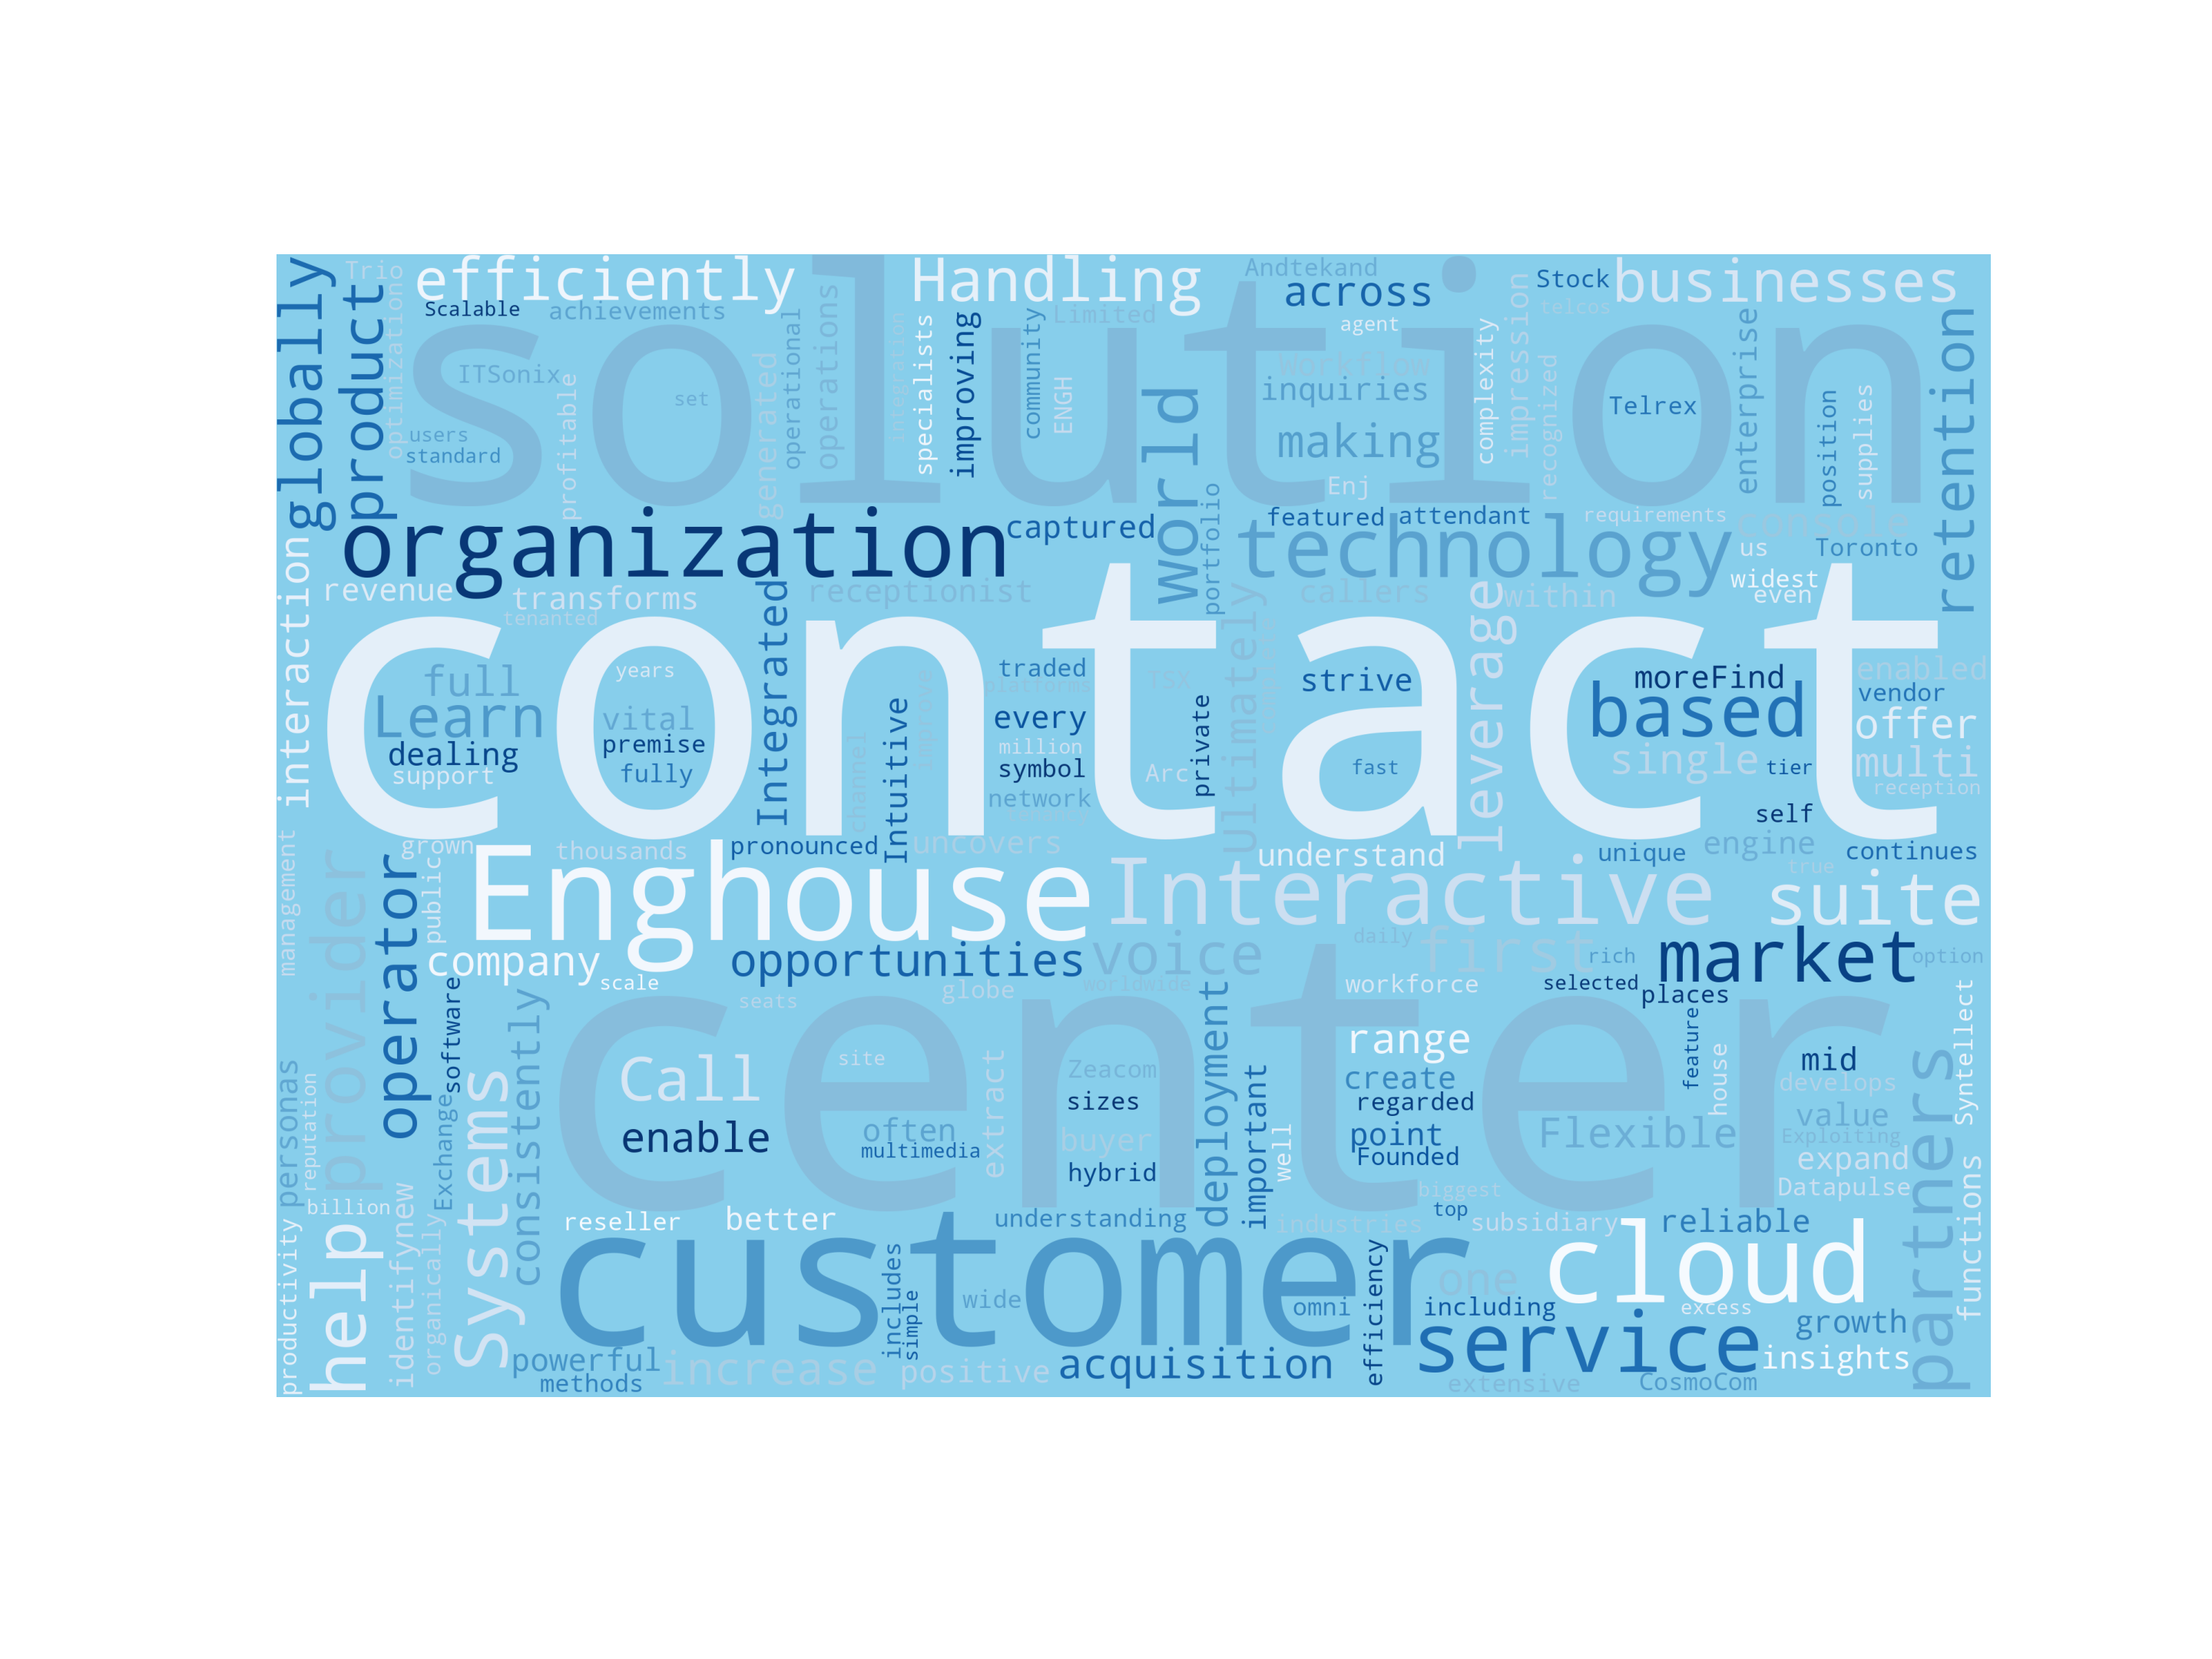
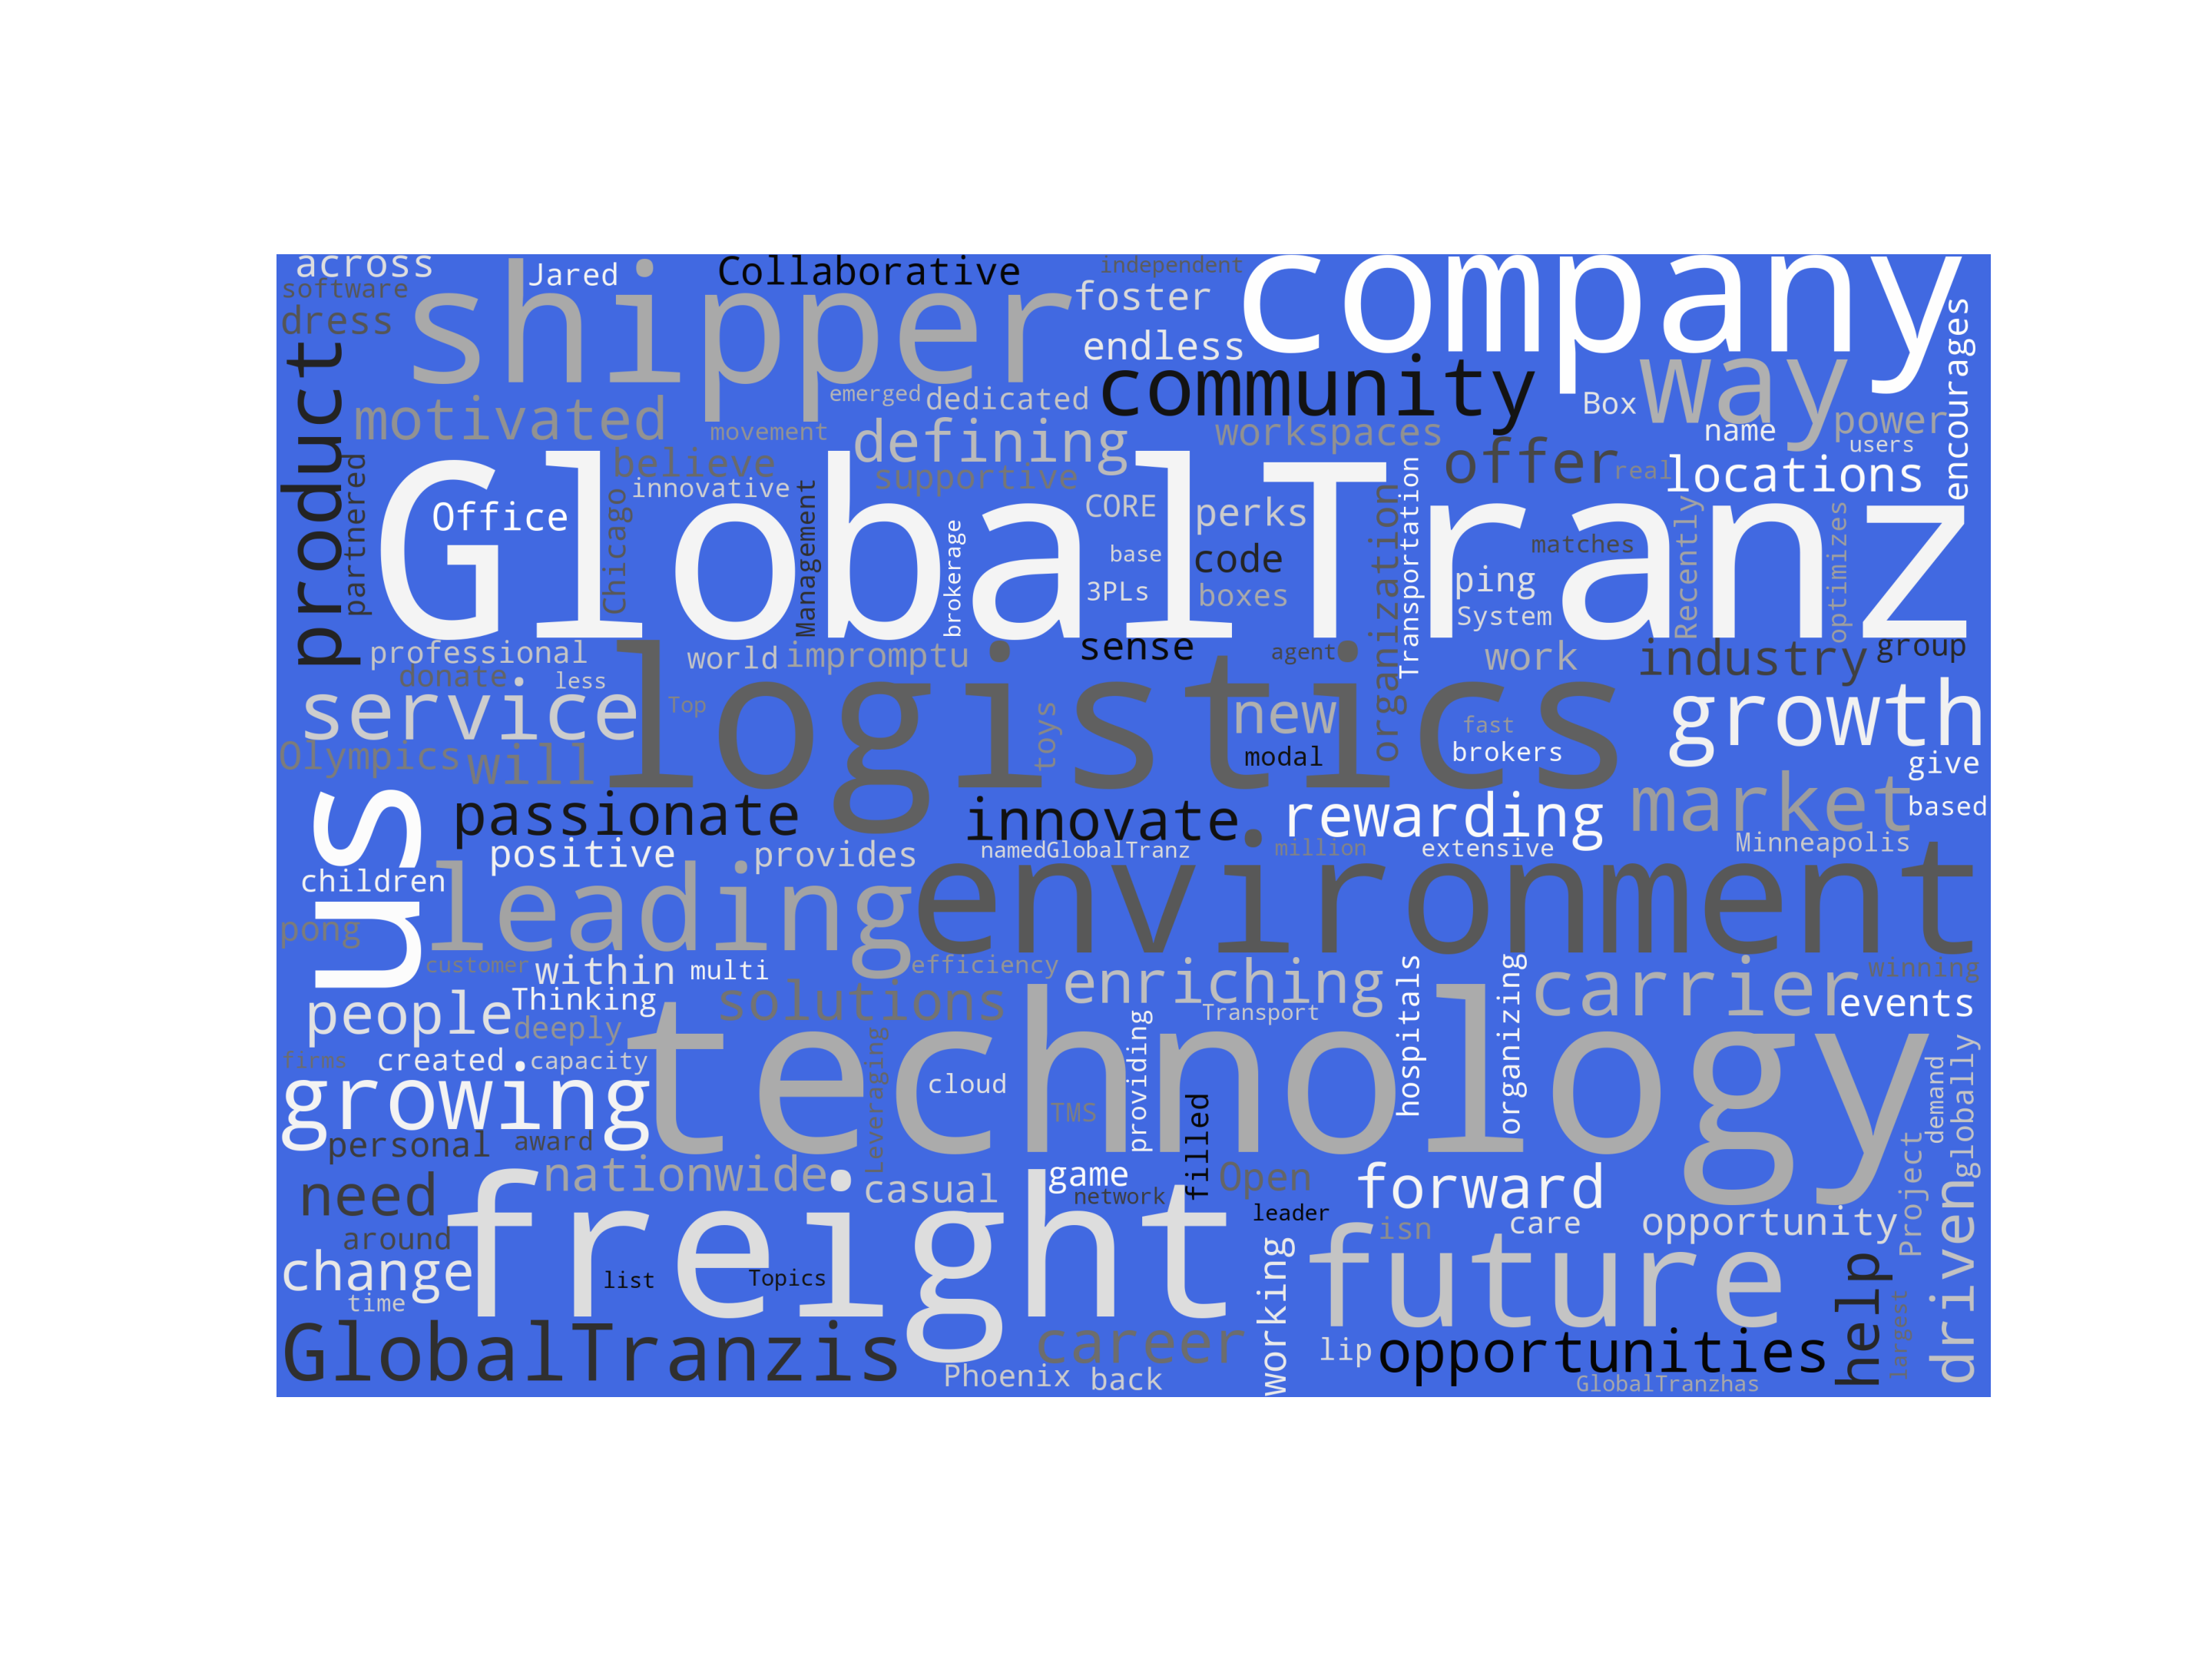
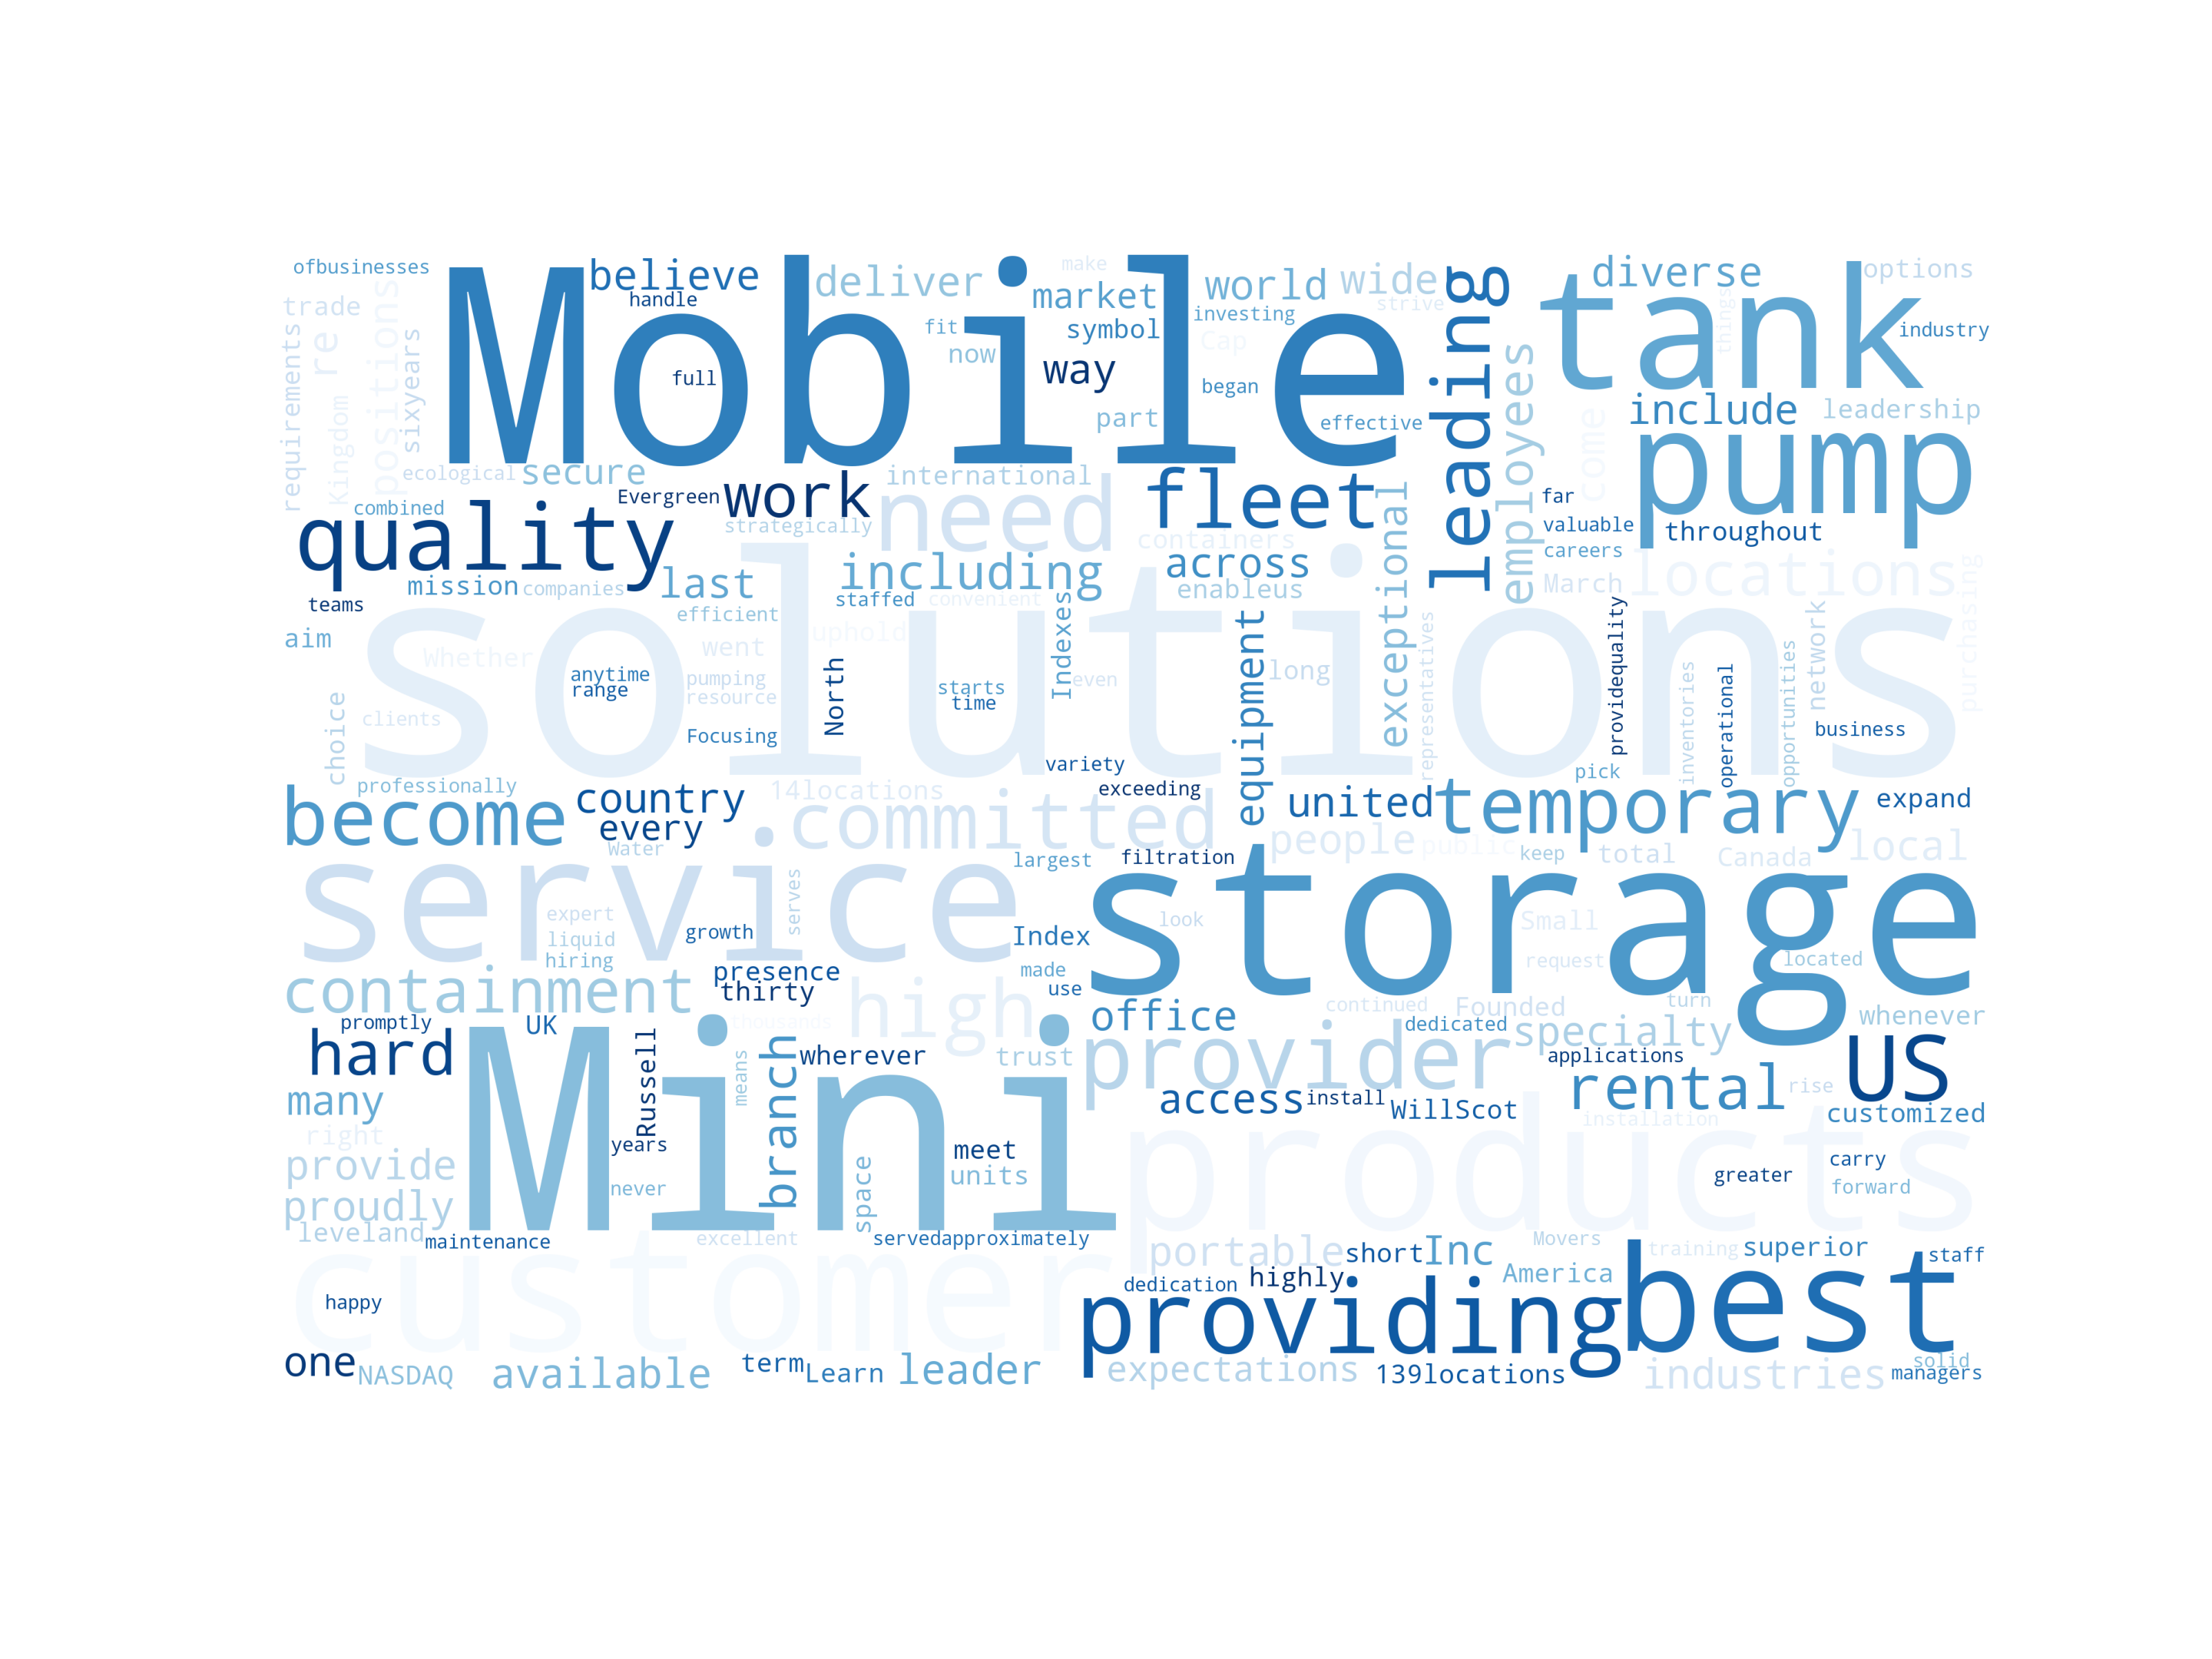
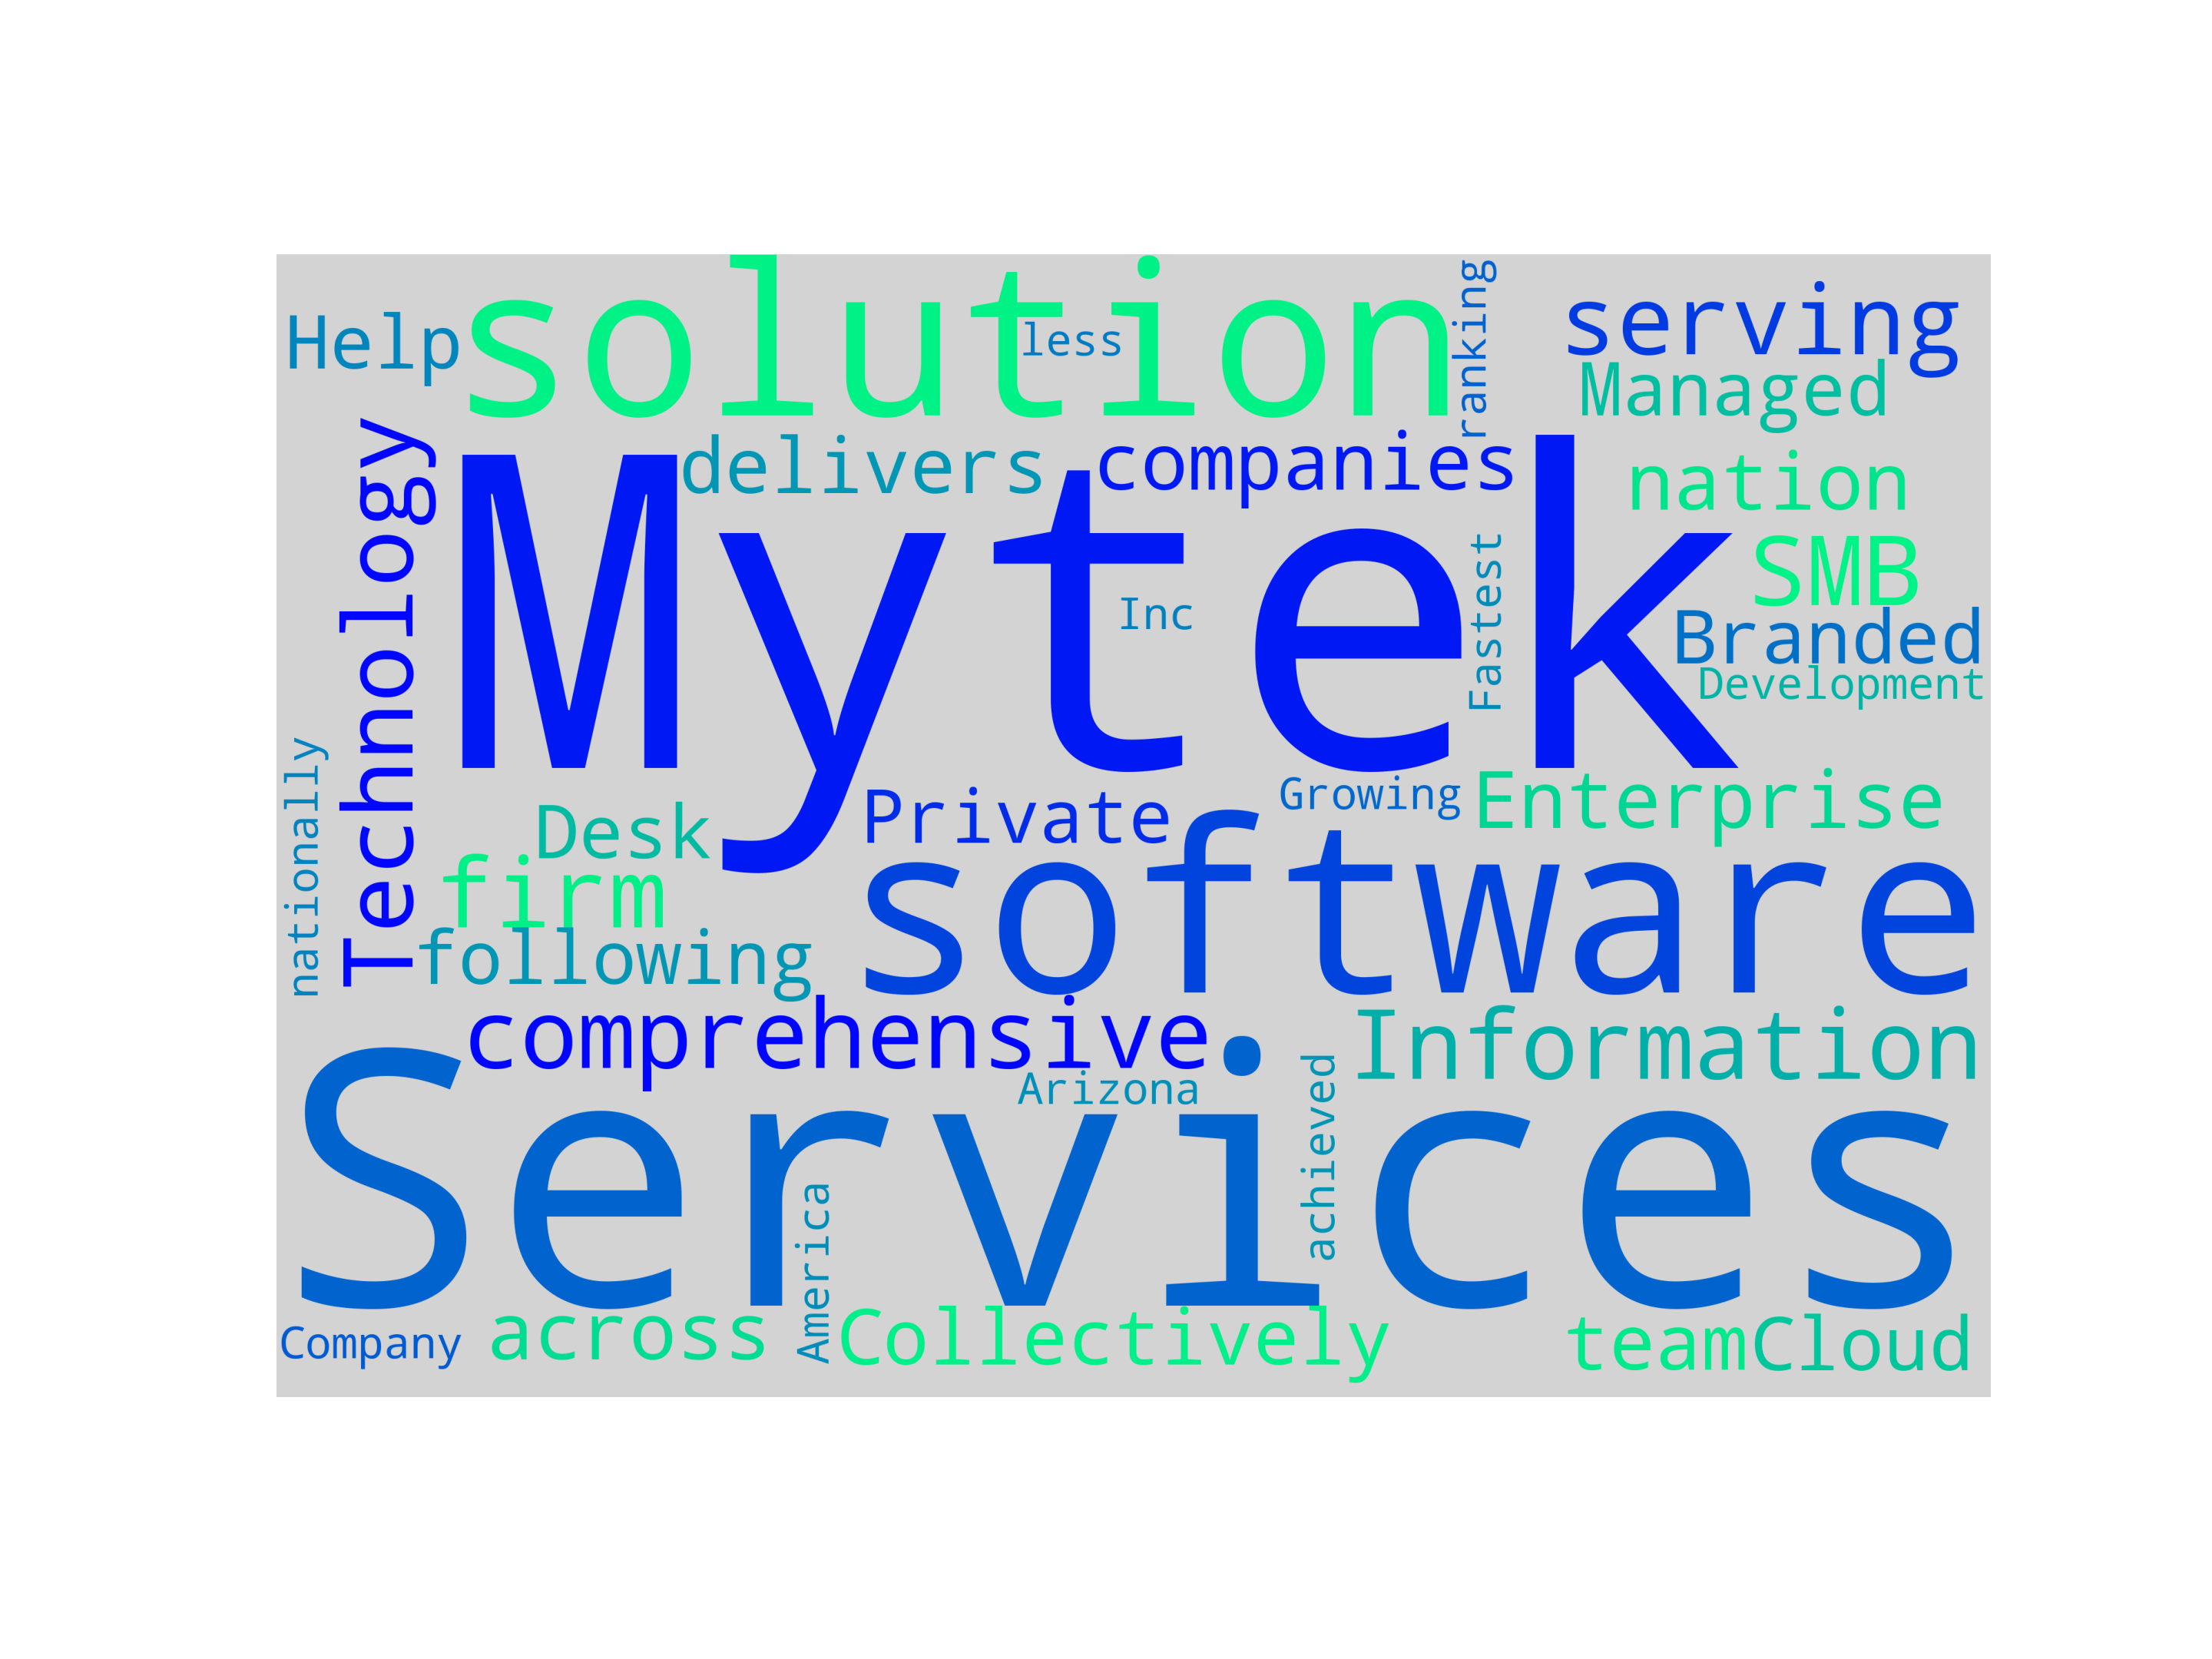
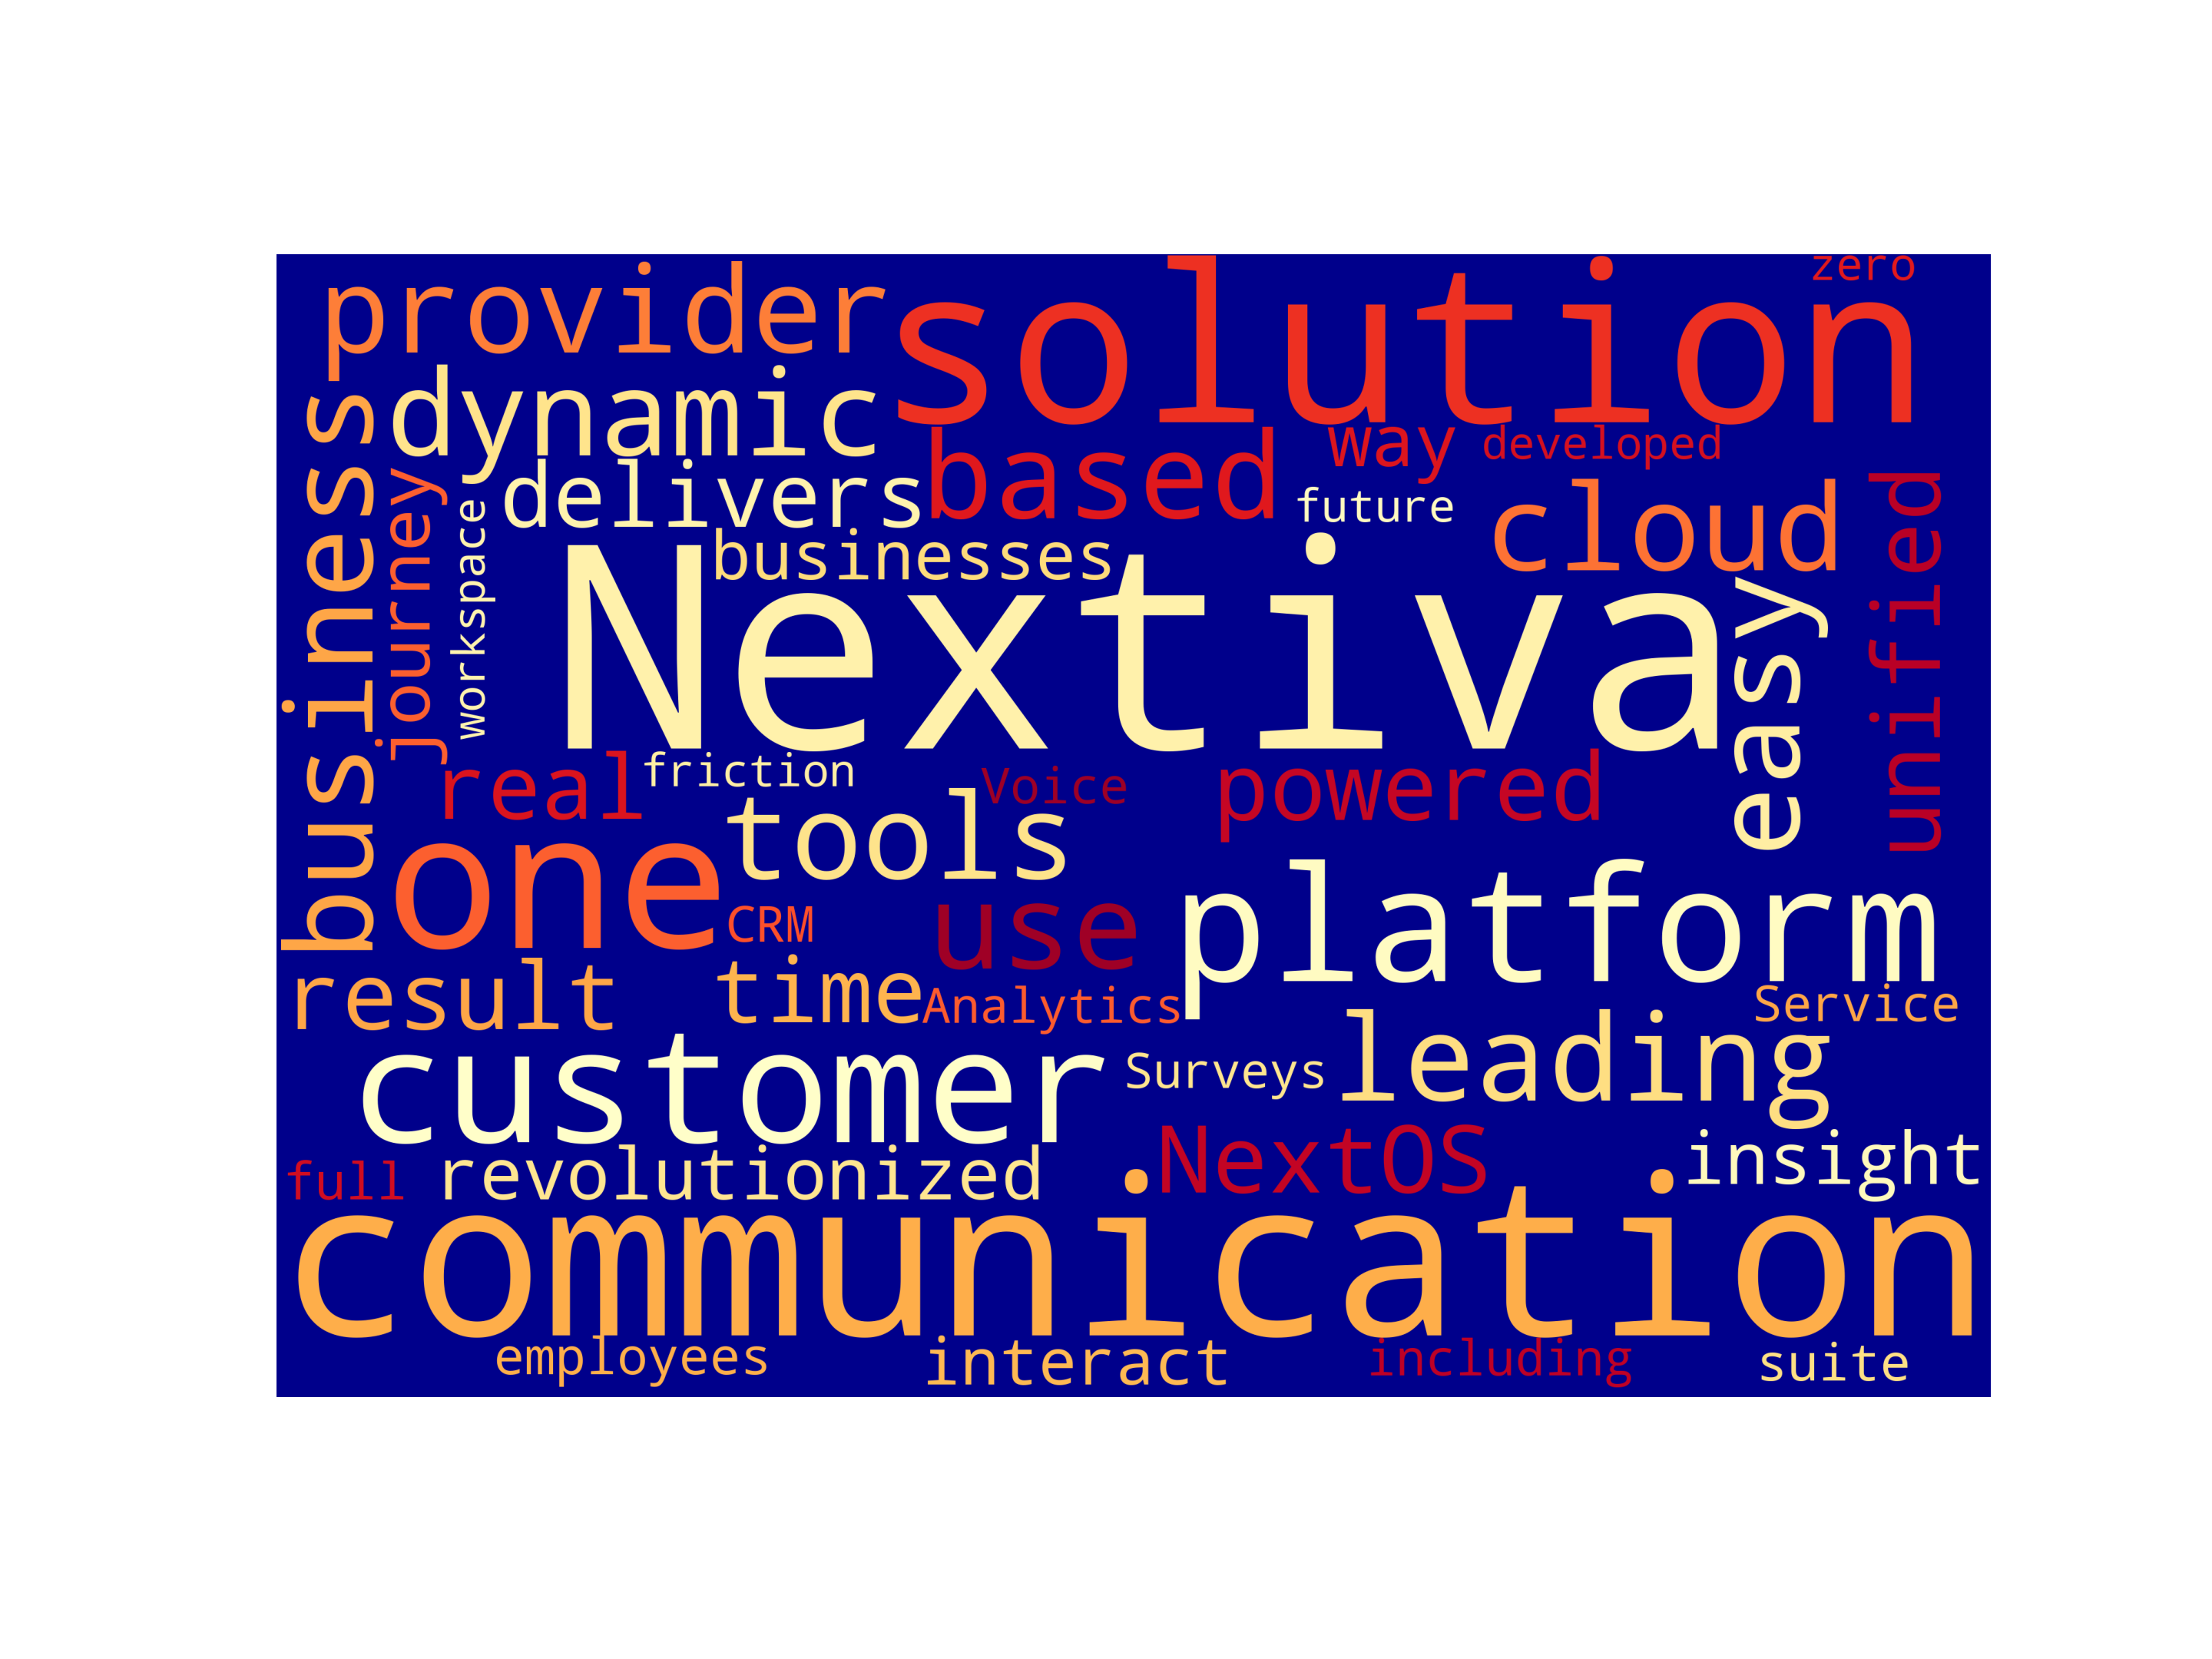
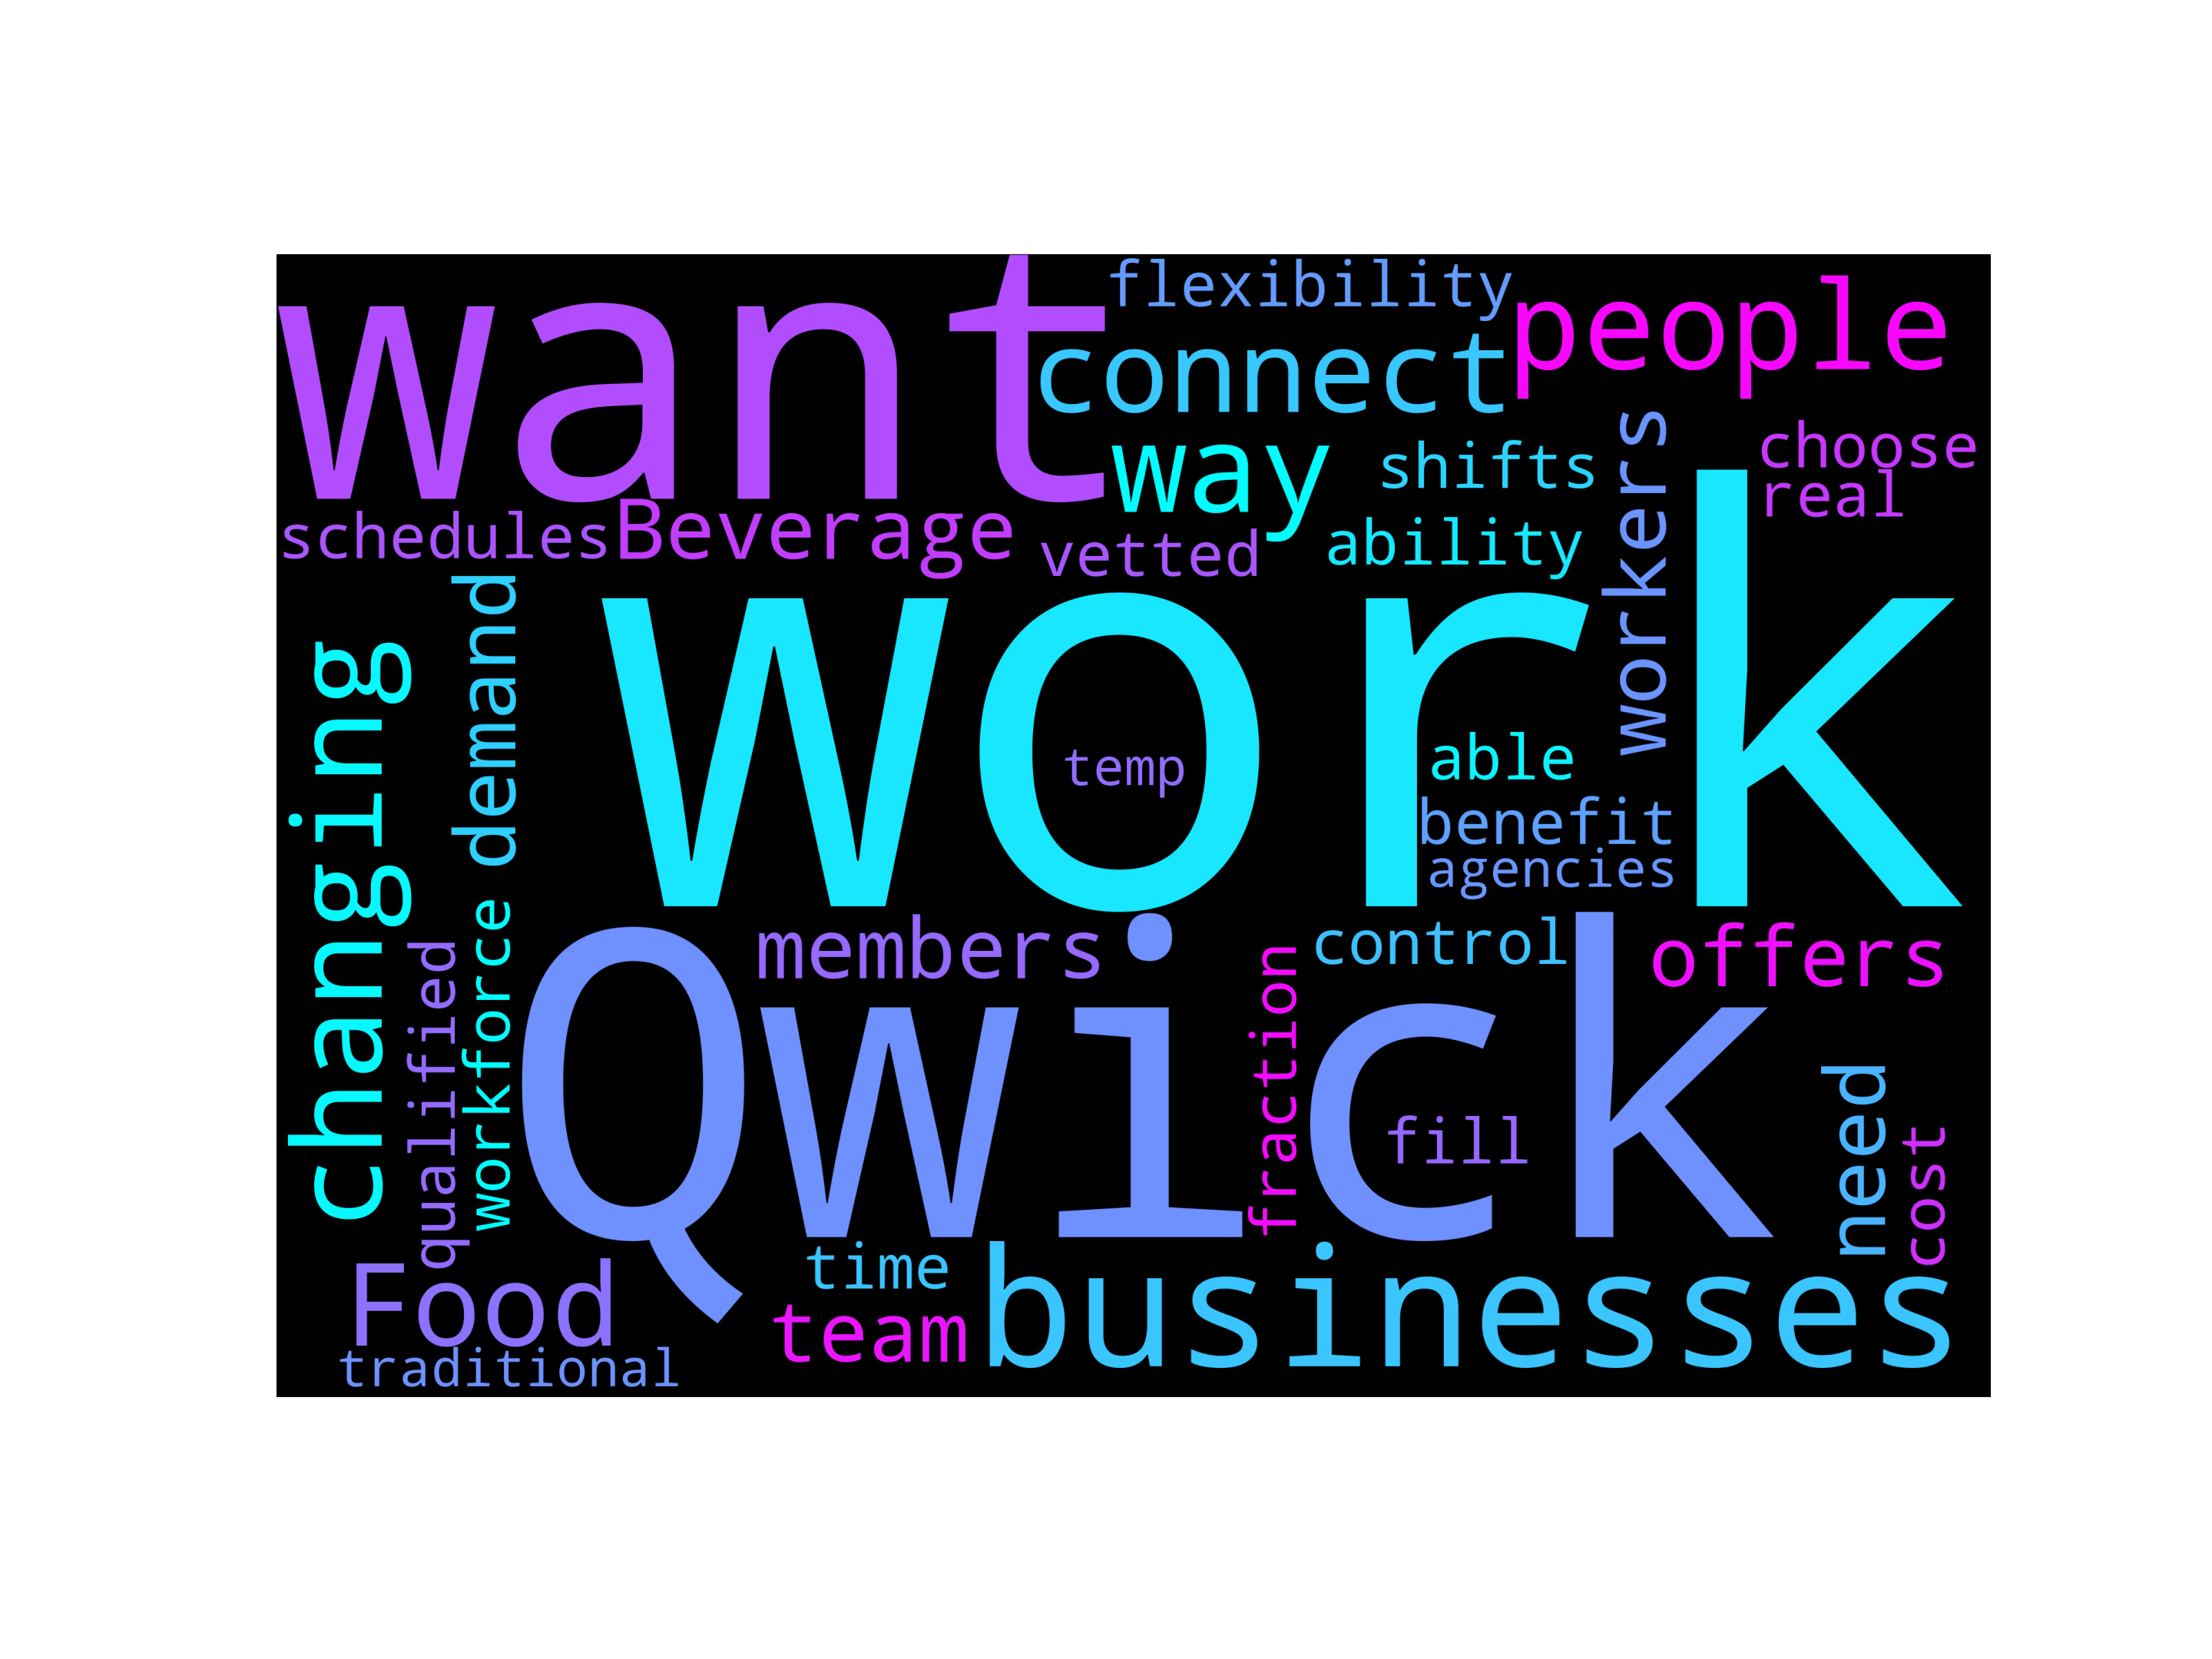
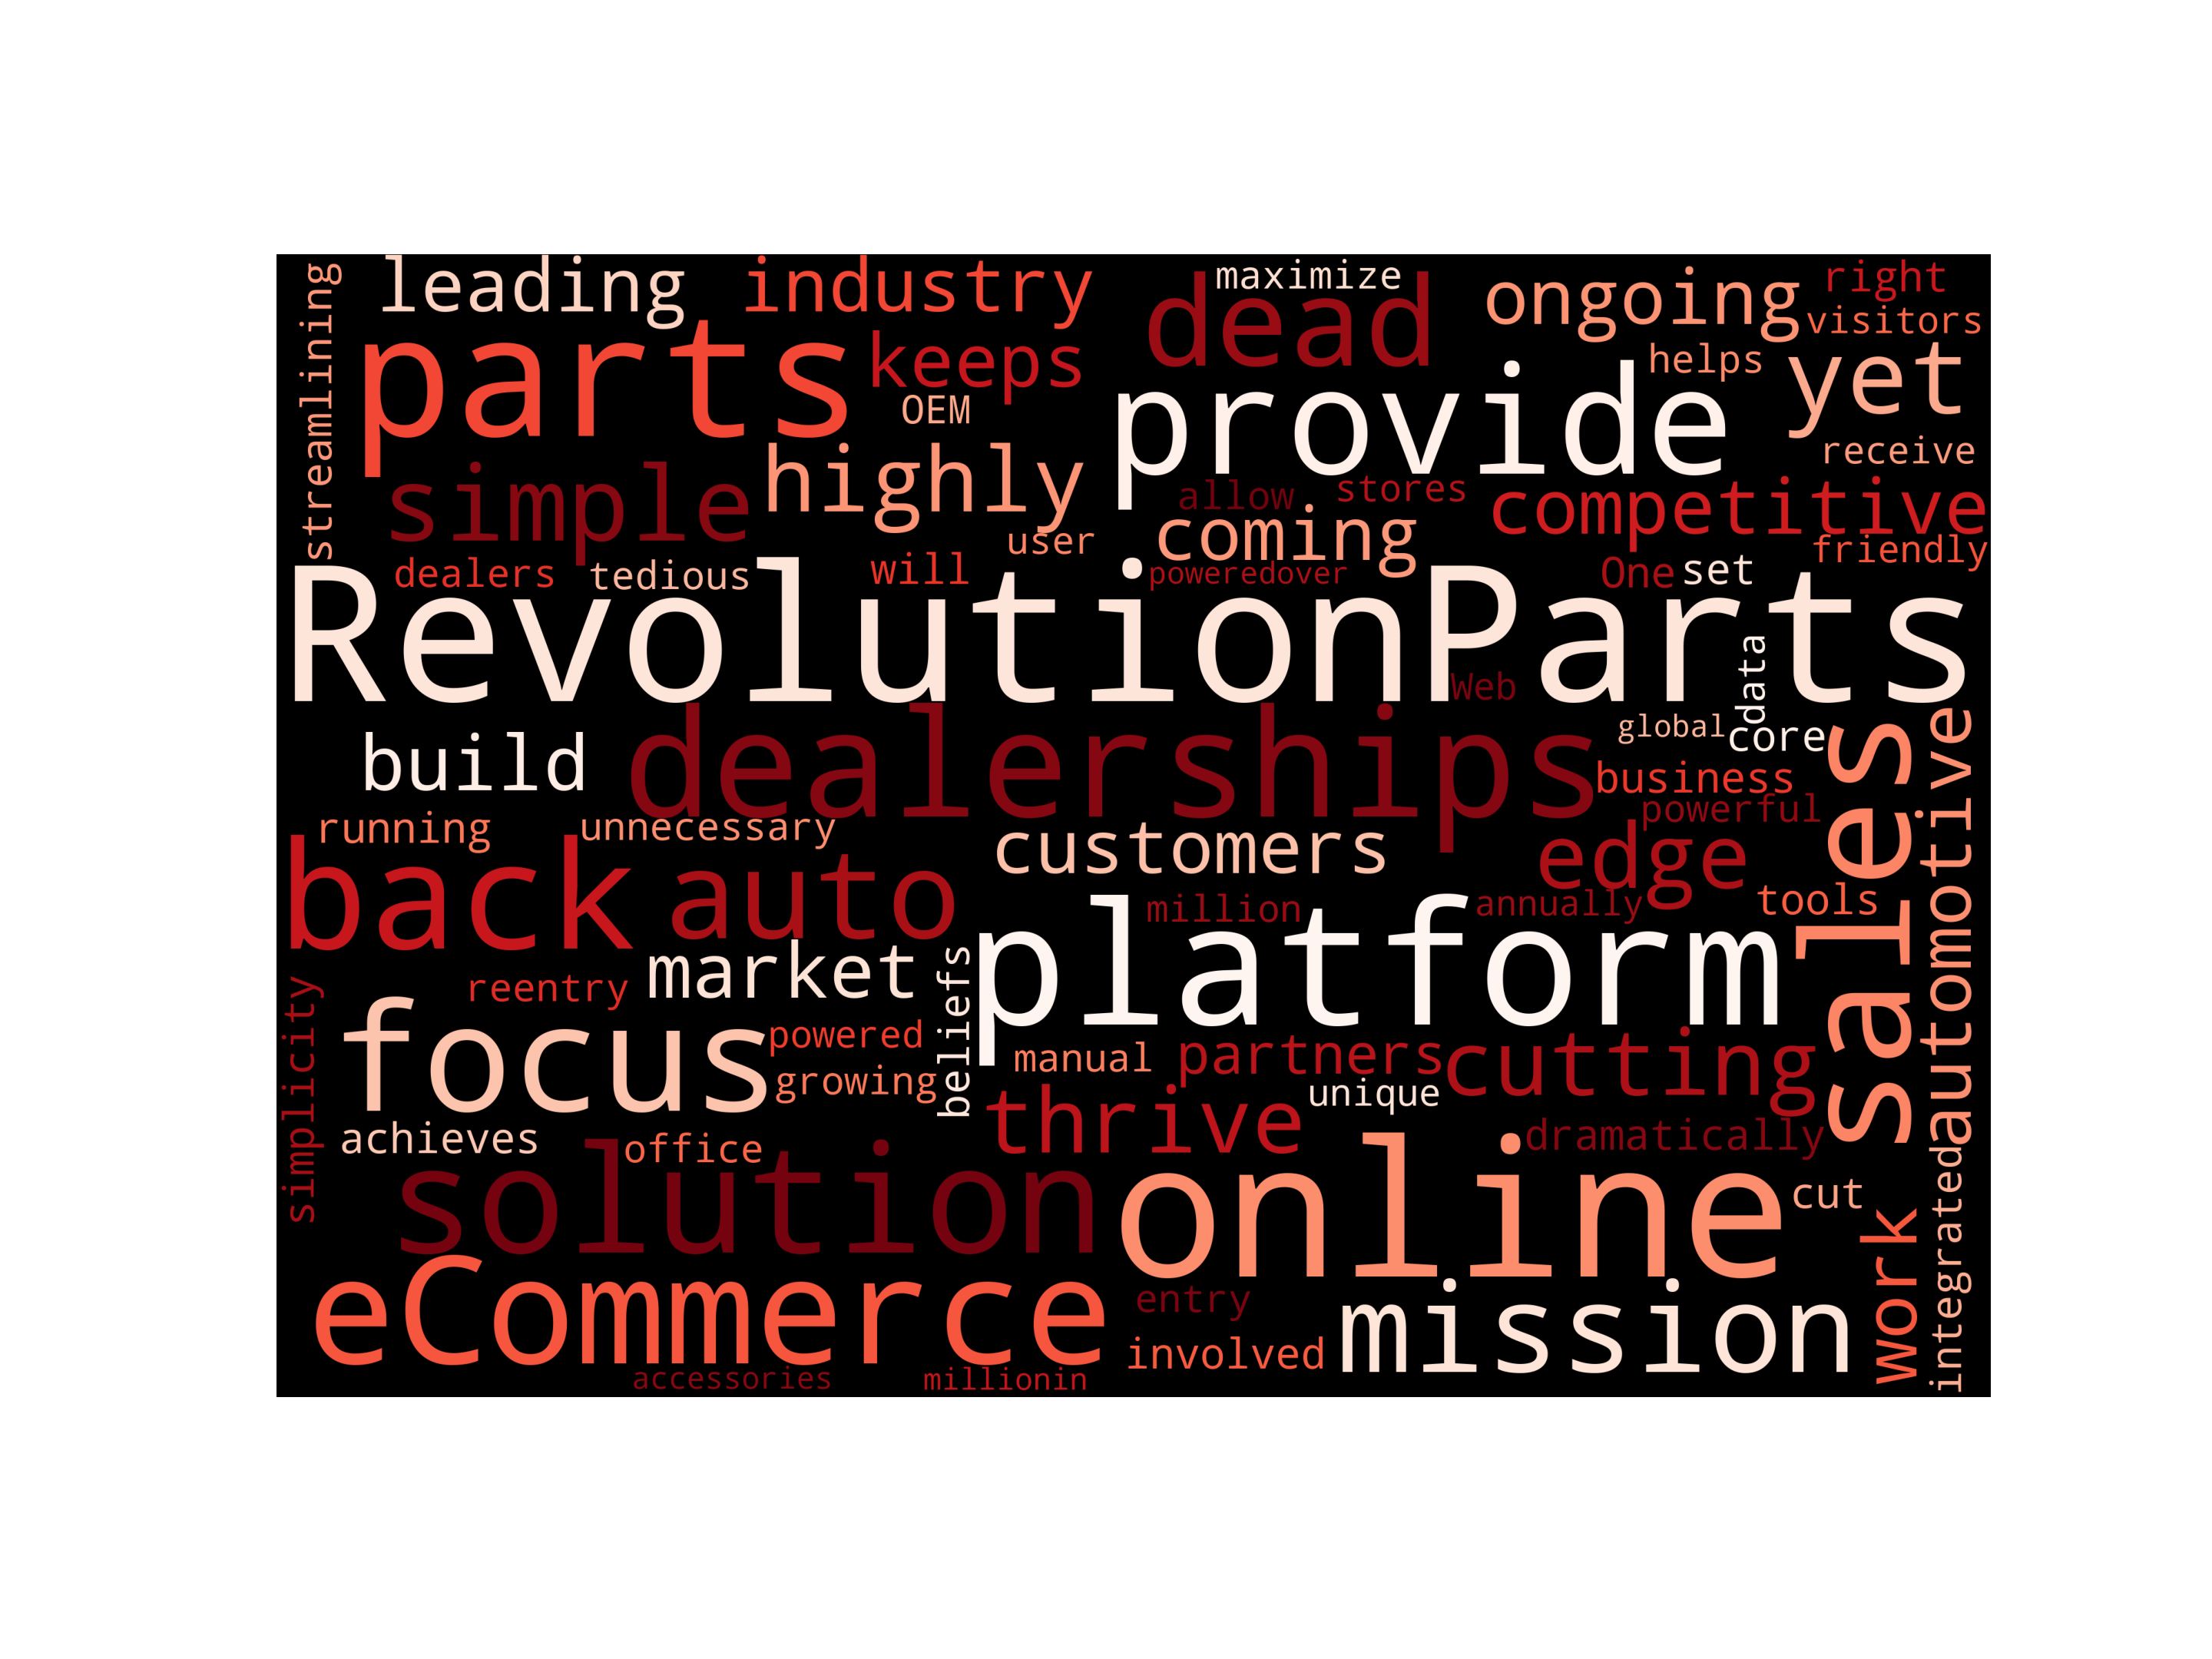
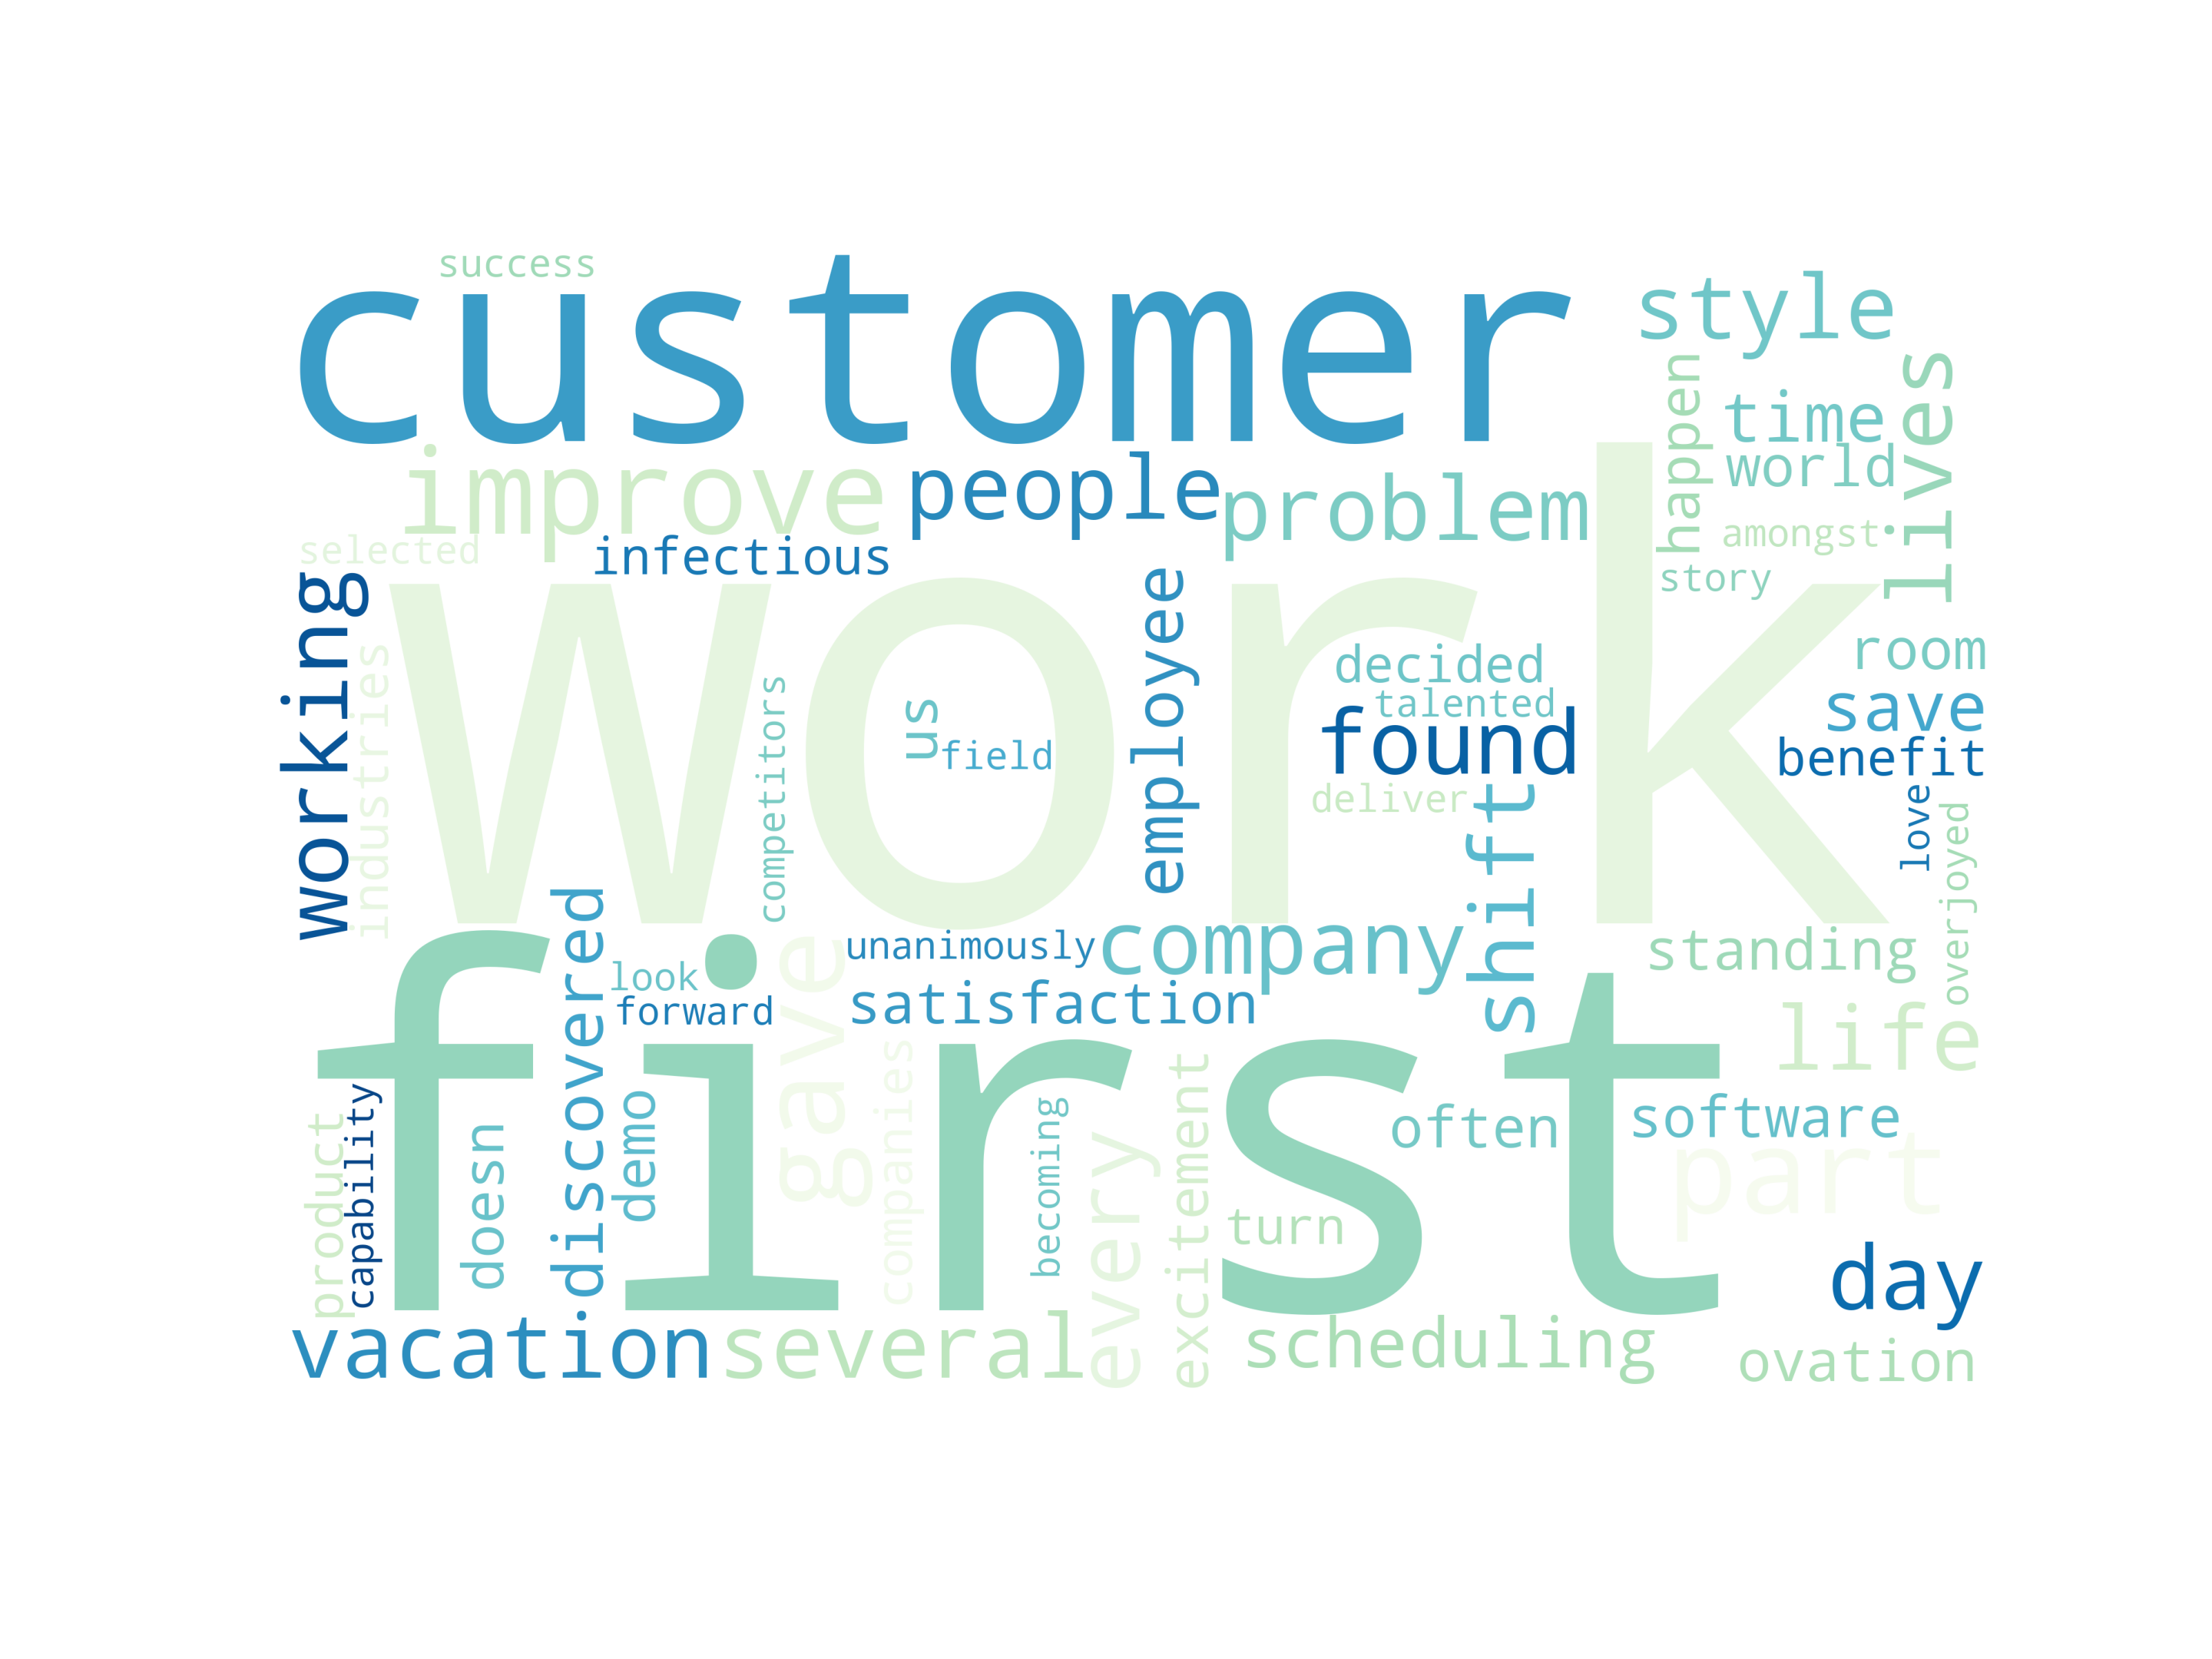
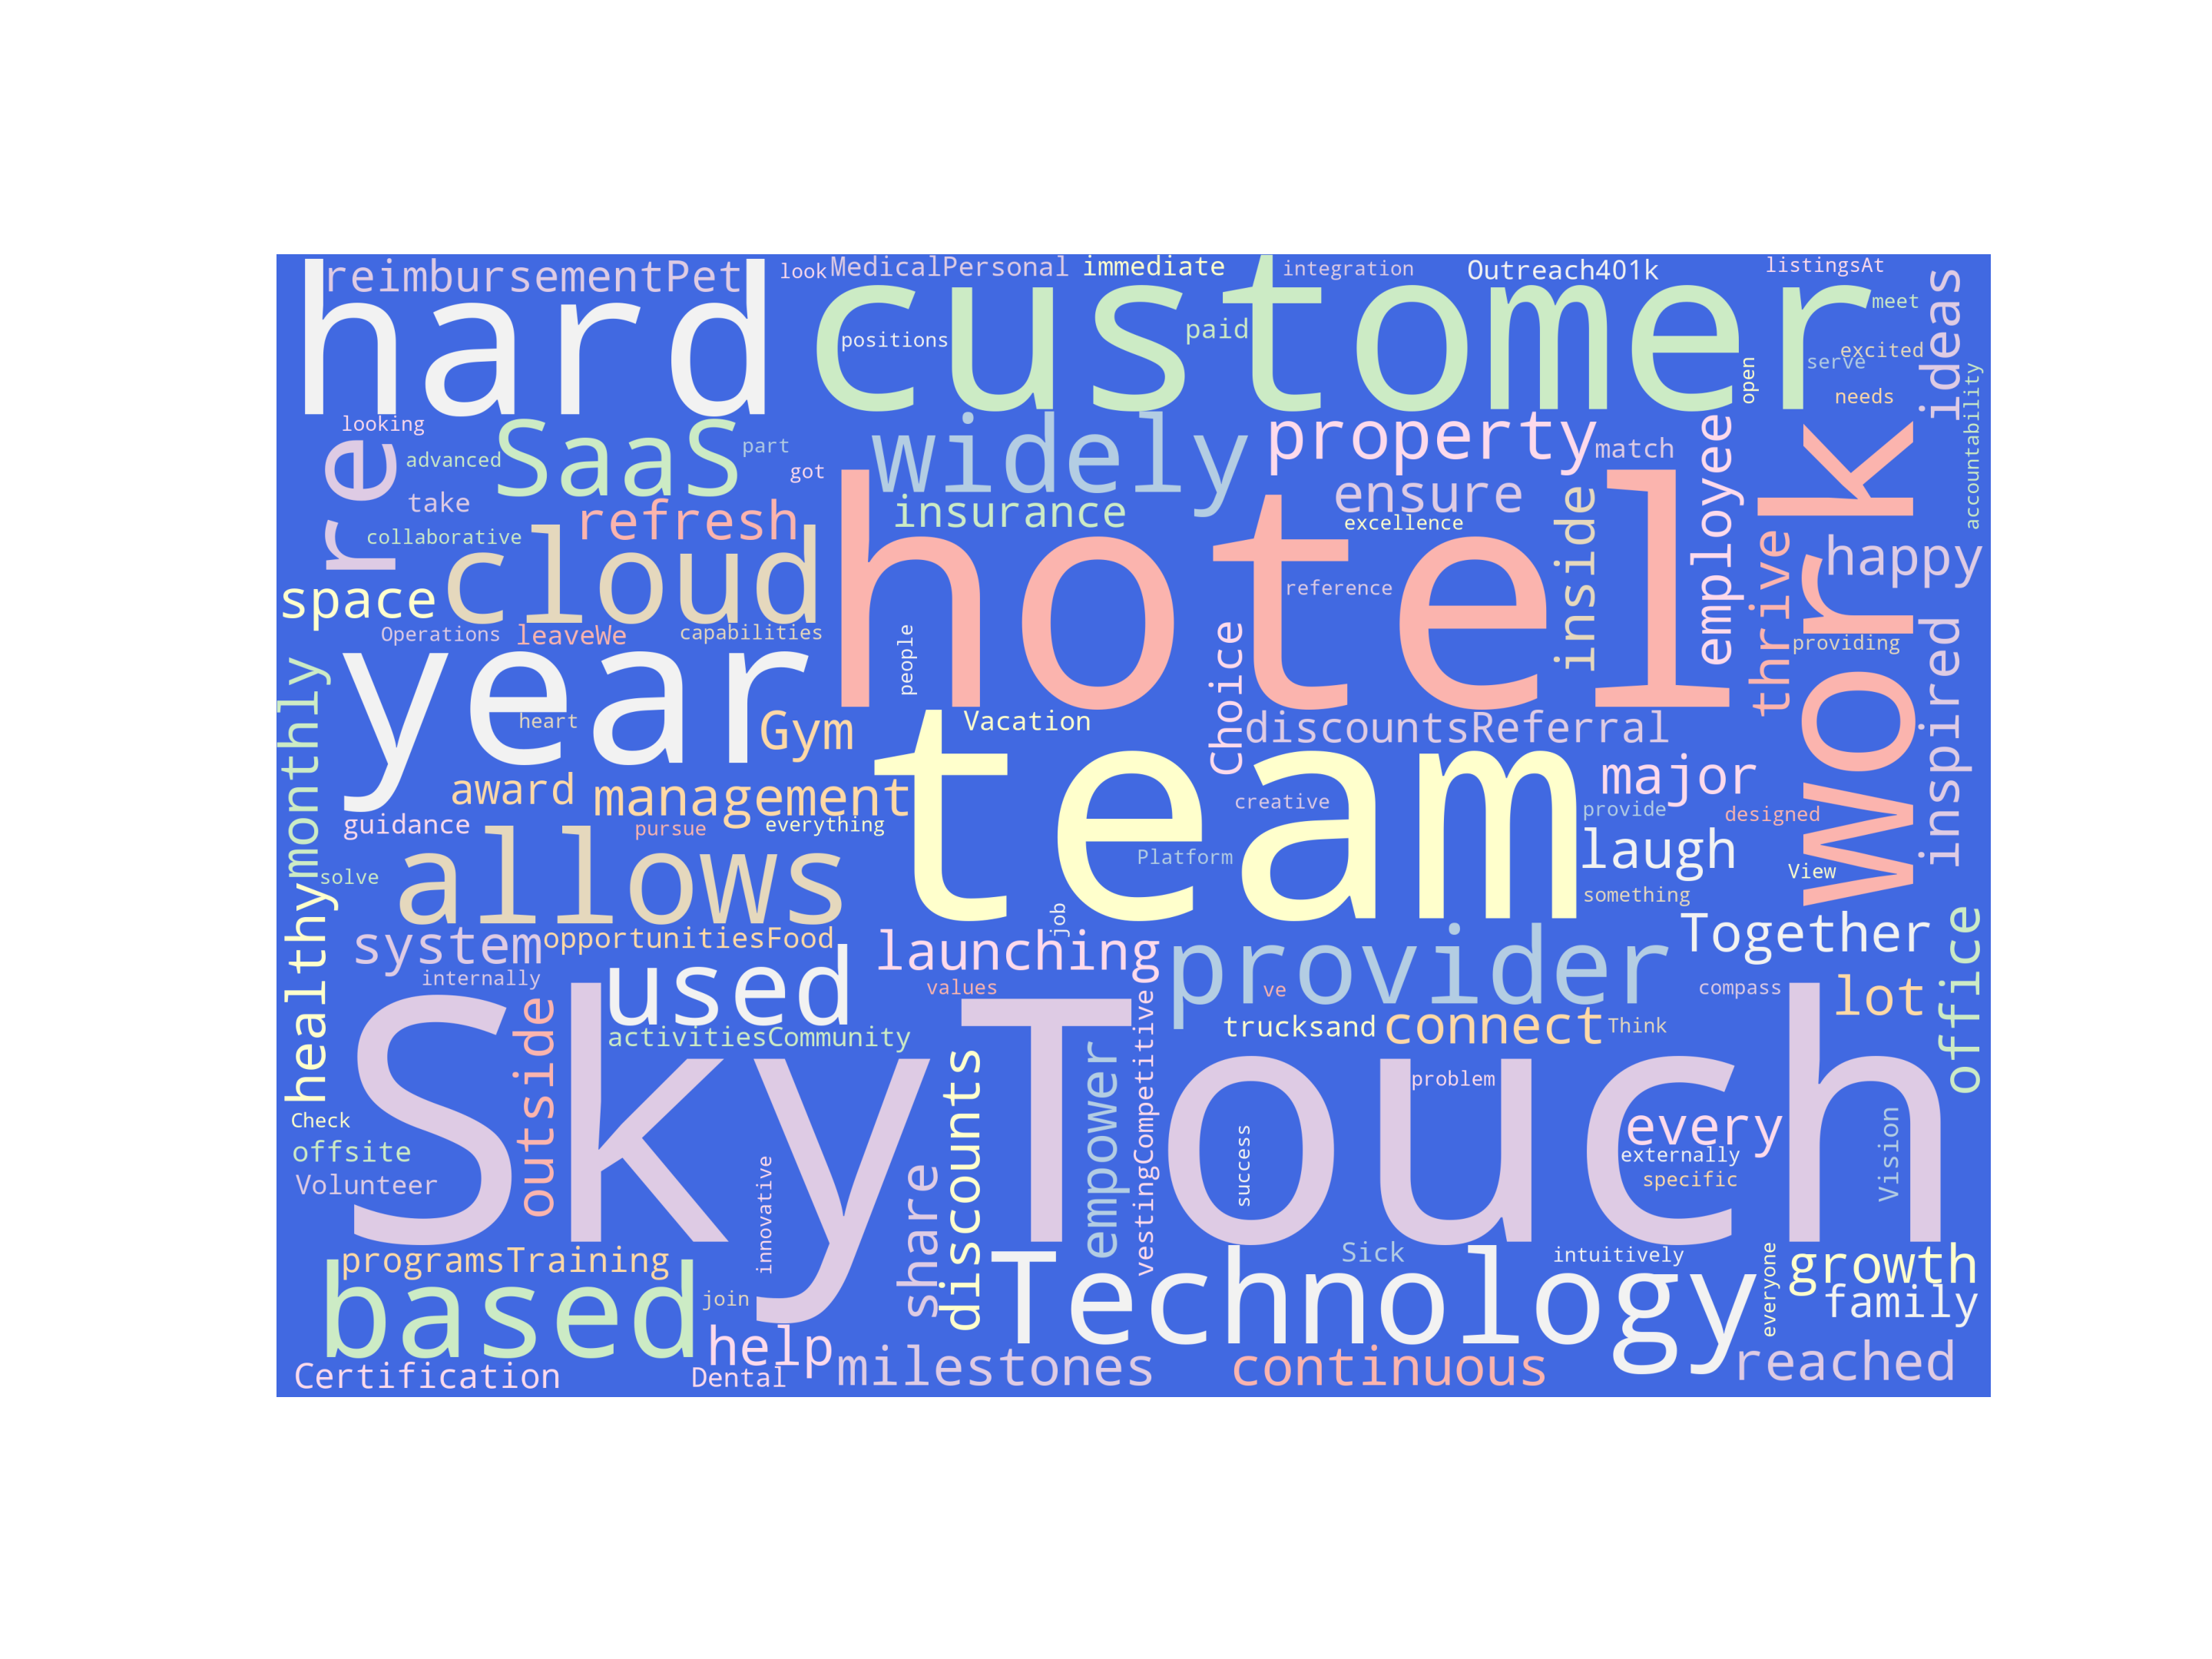
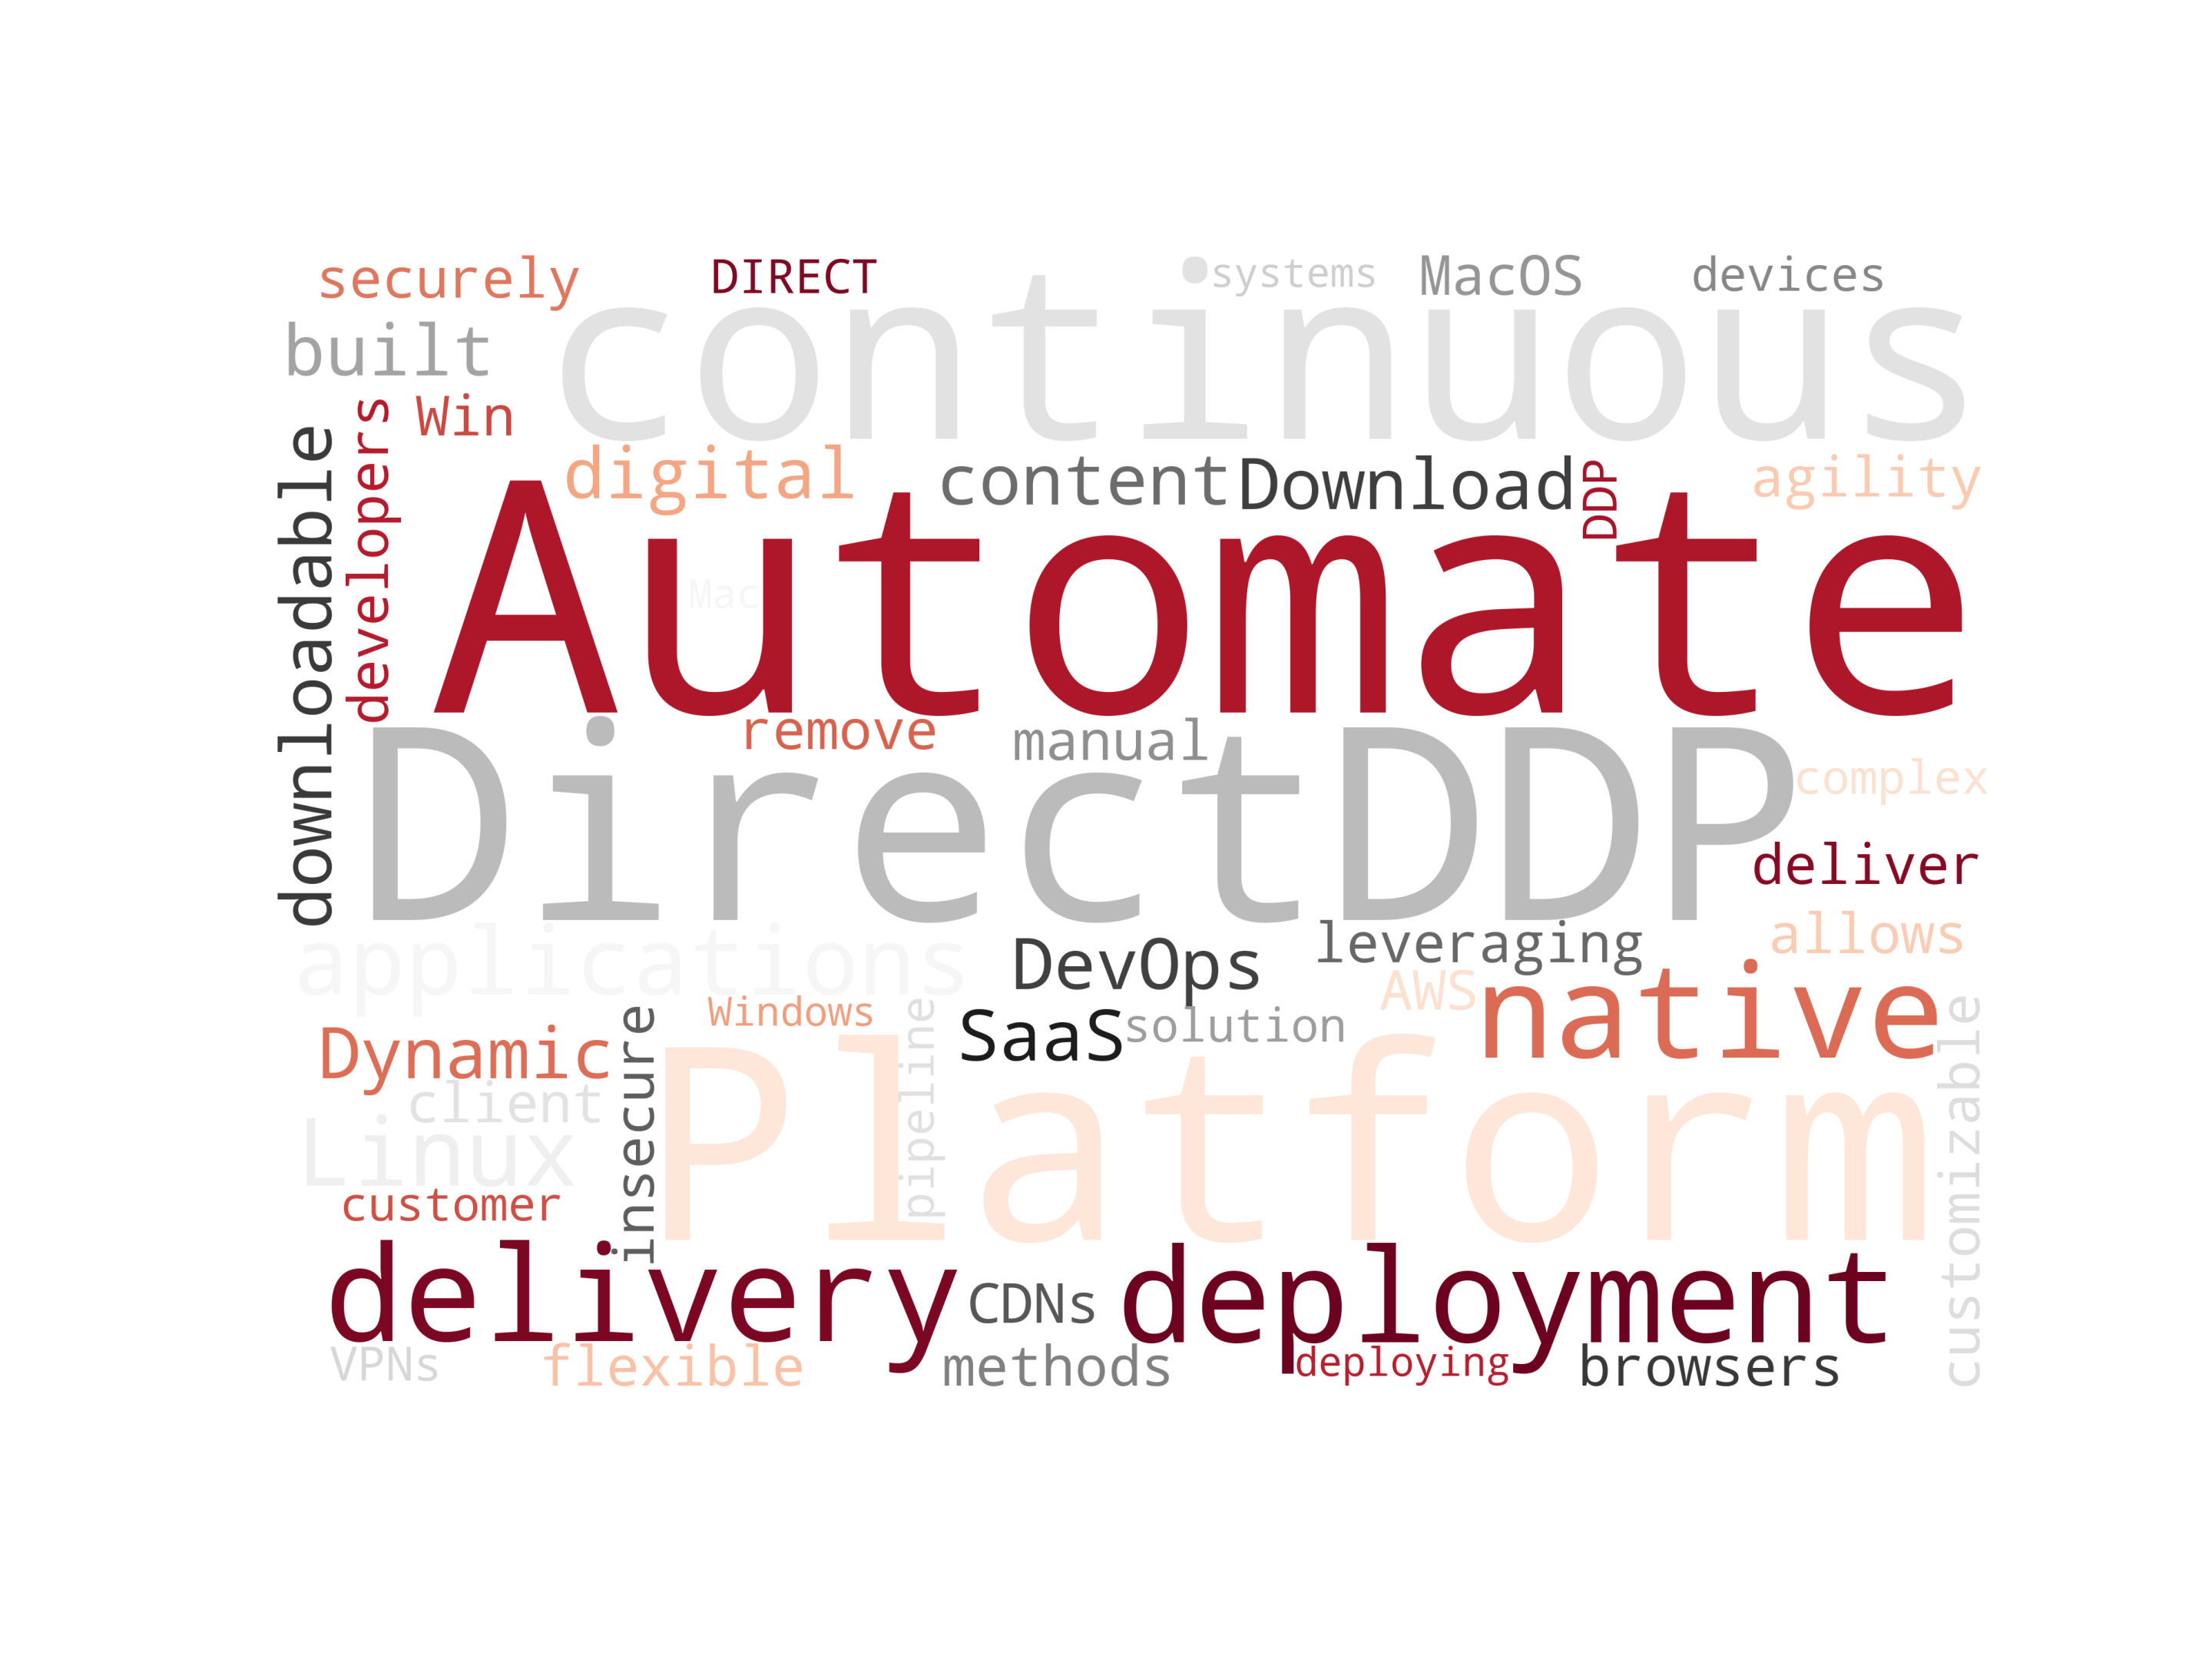
Word Clouds
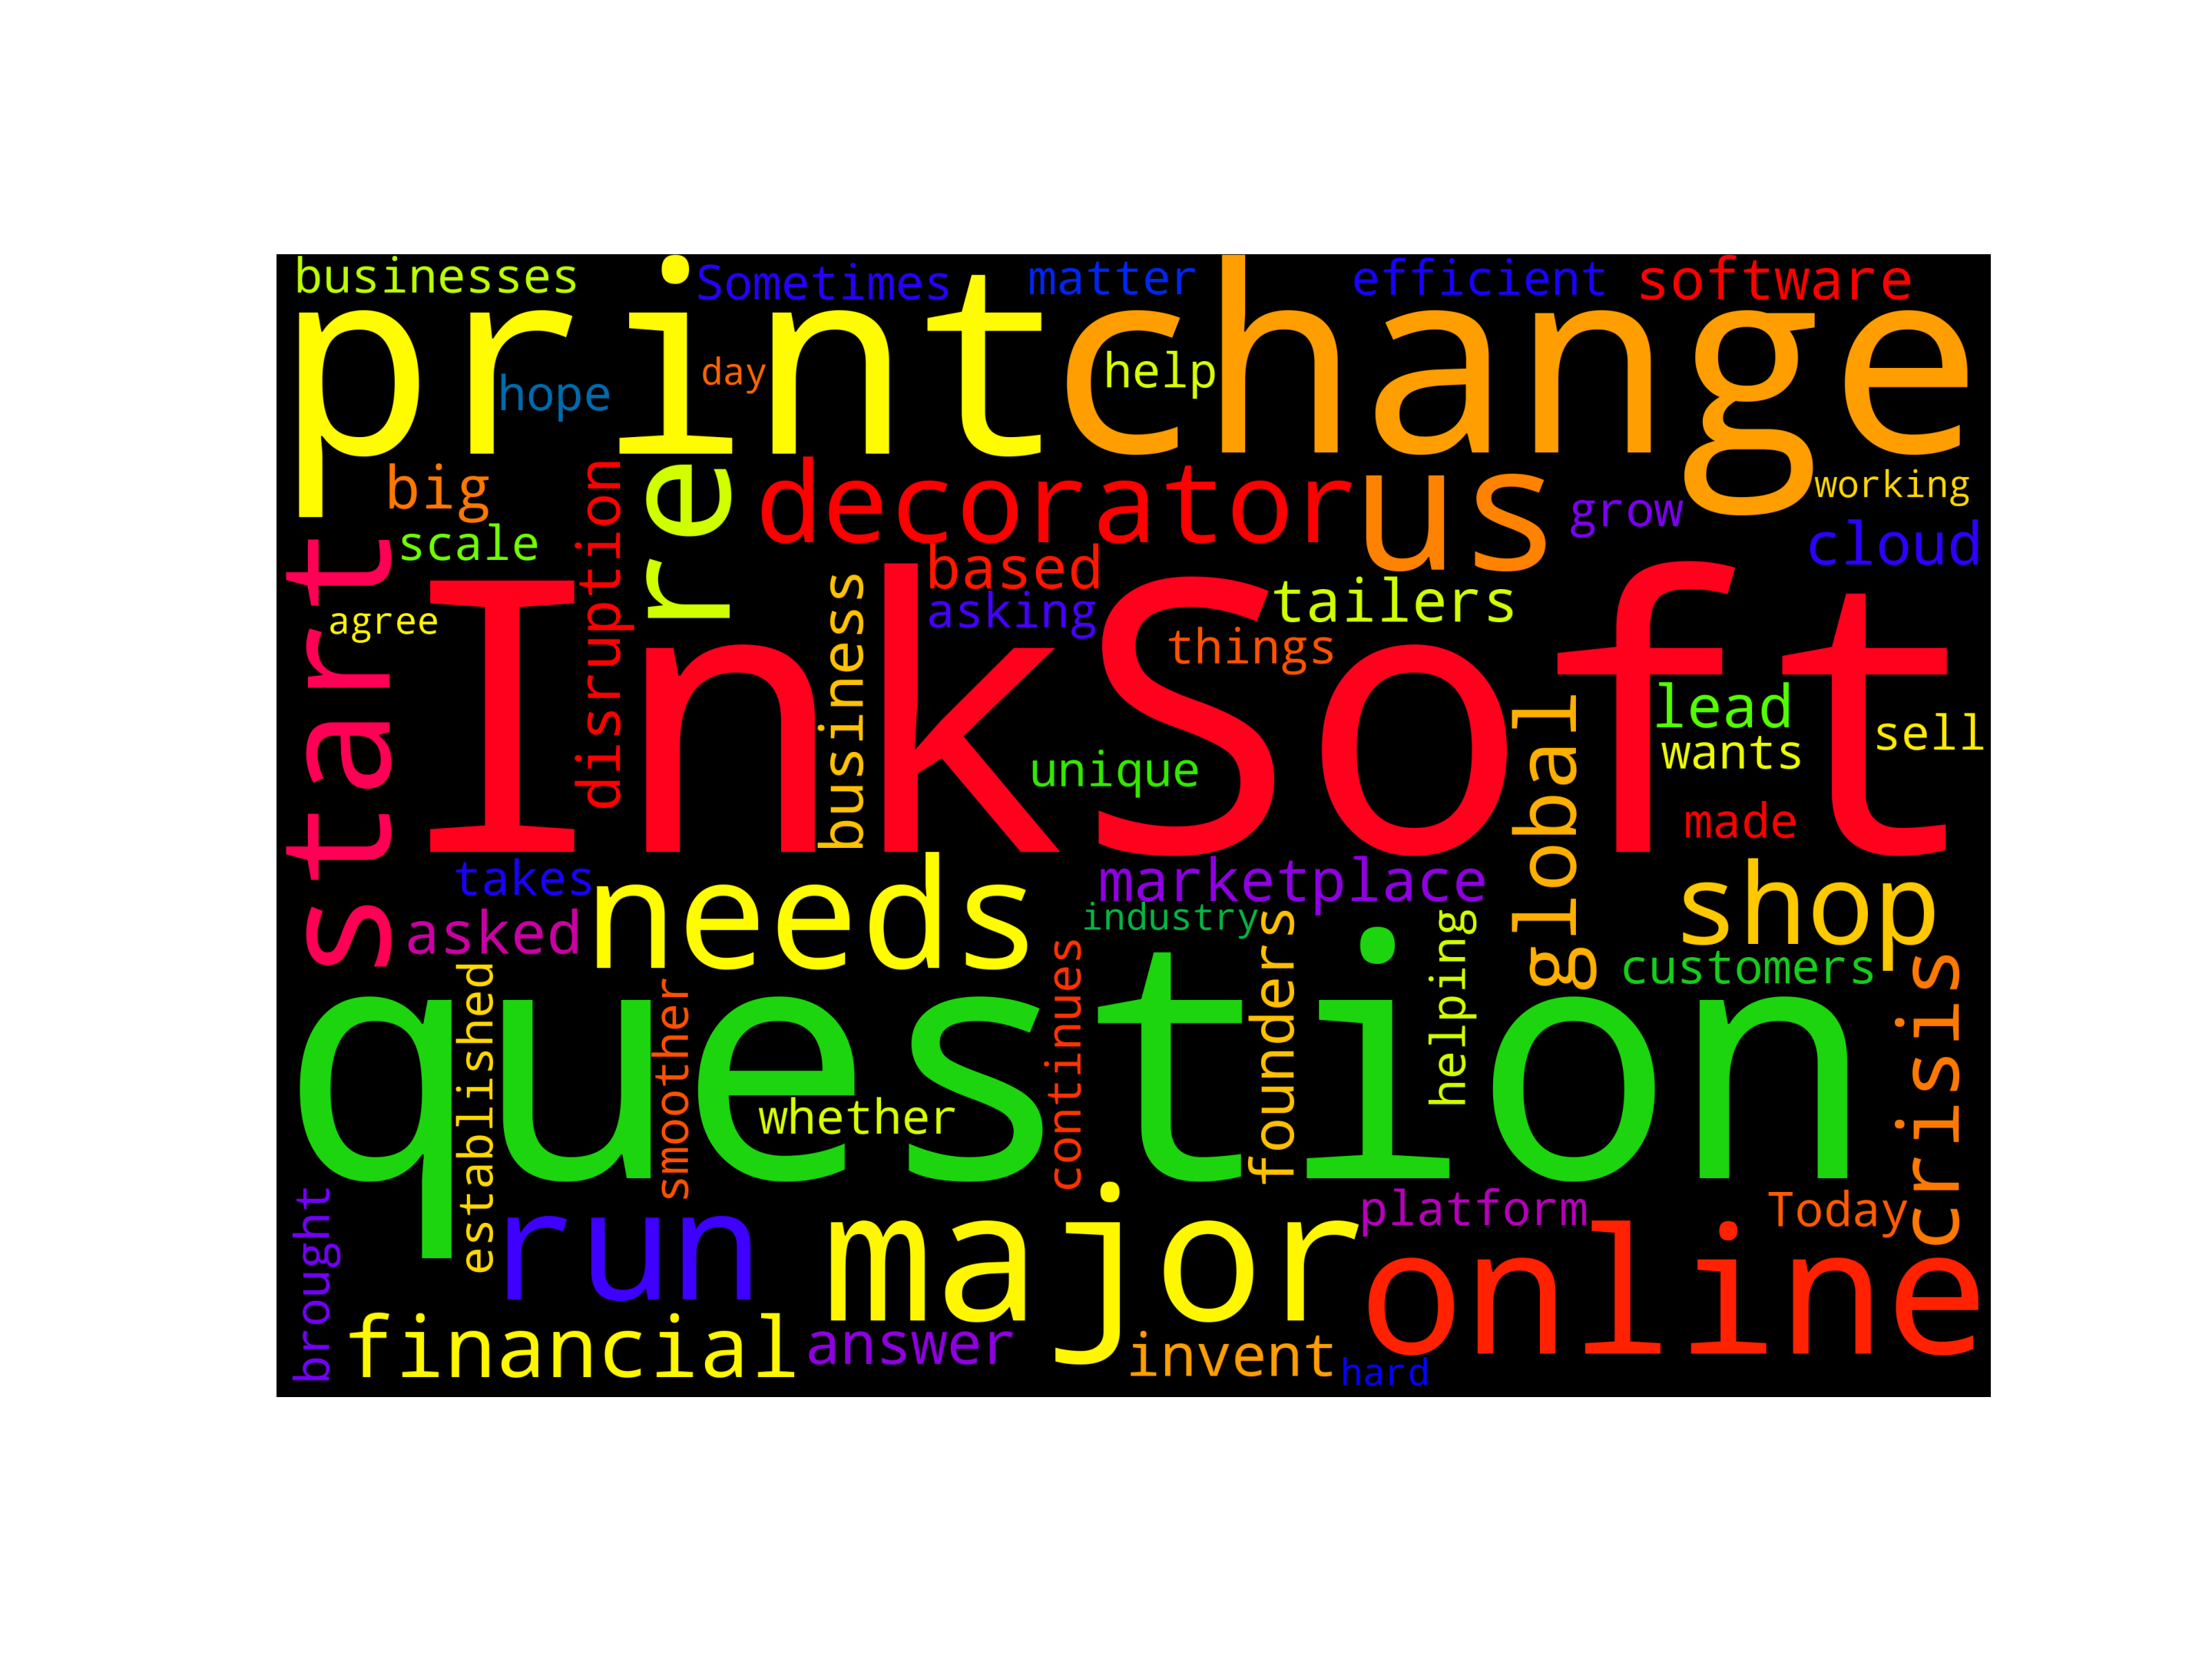
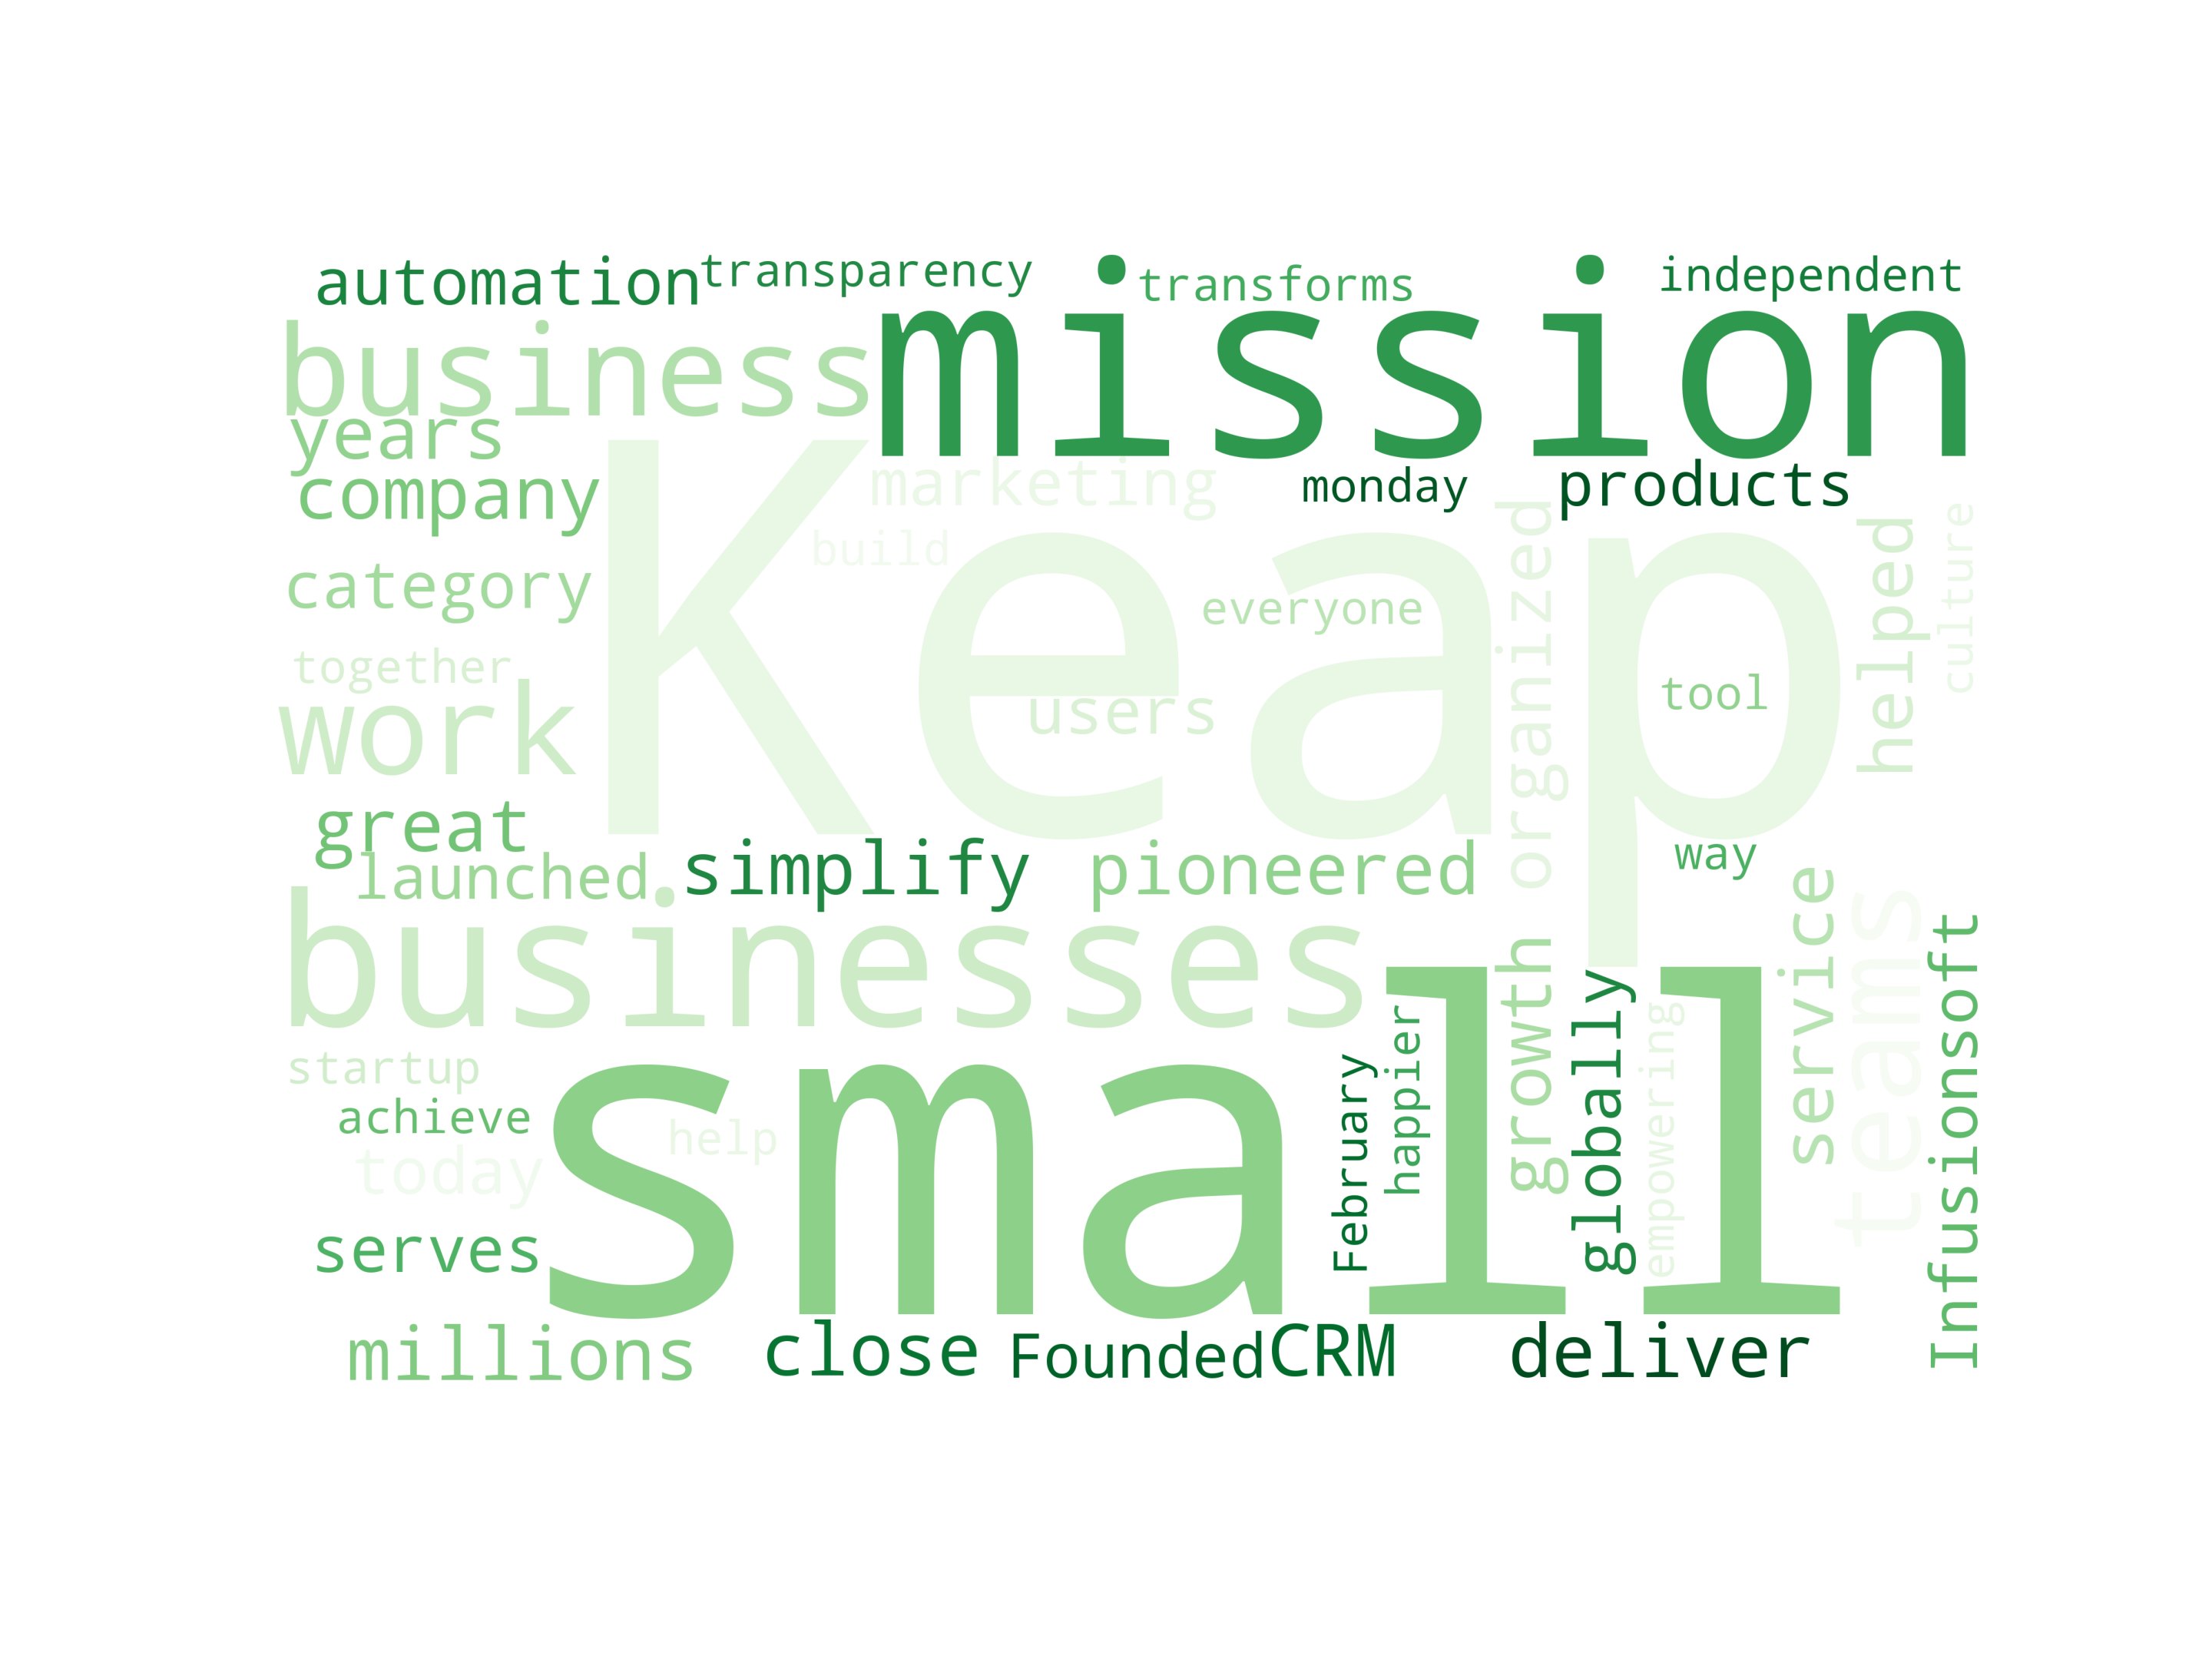
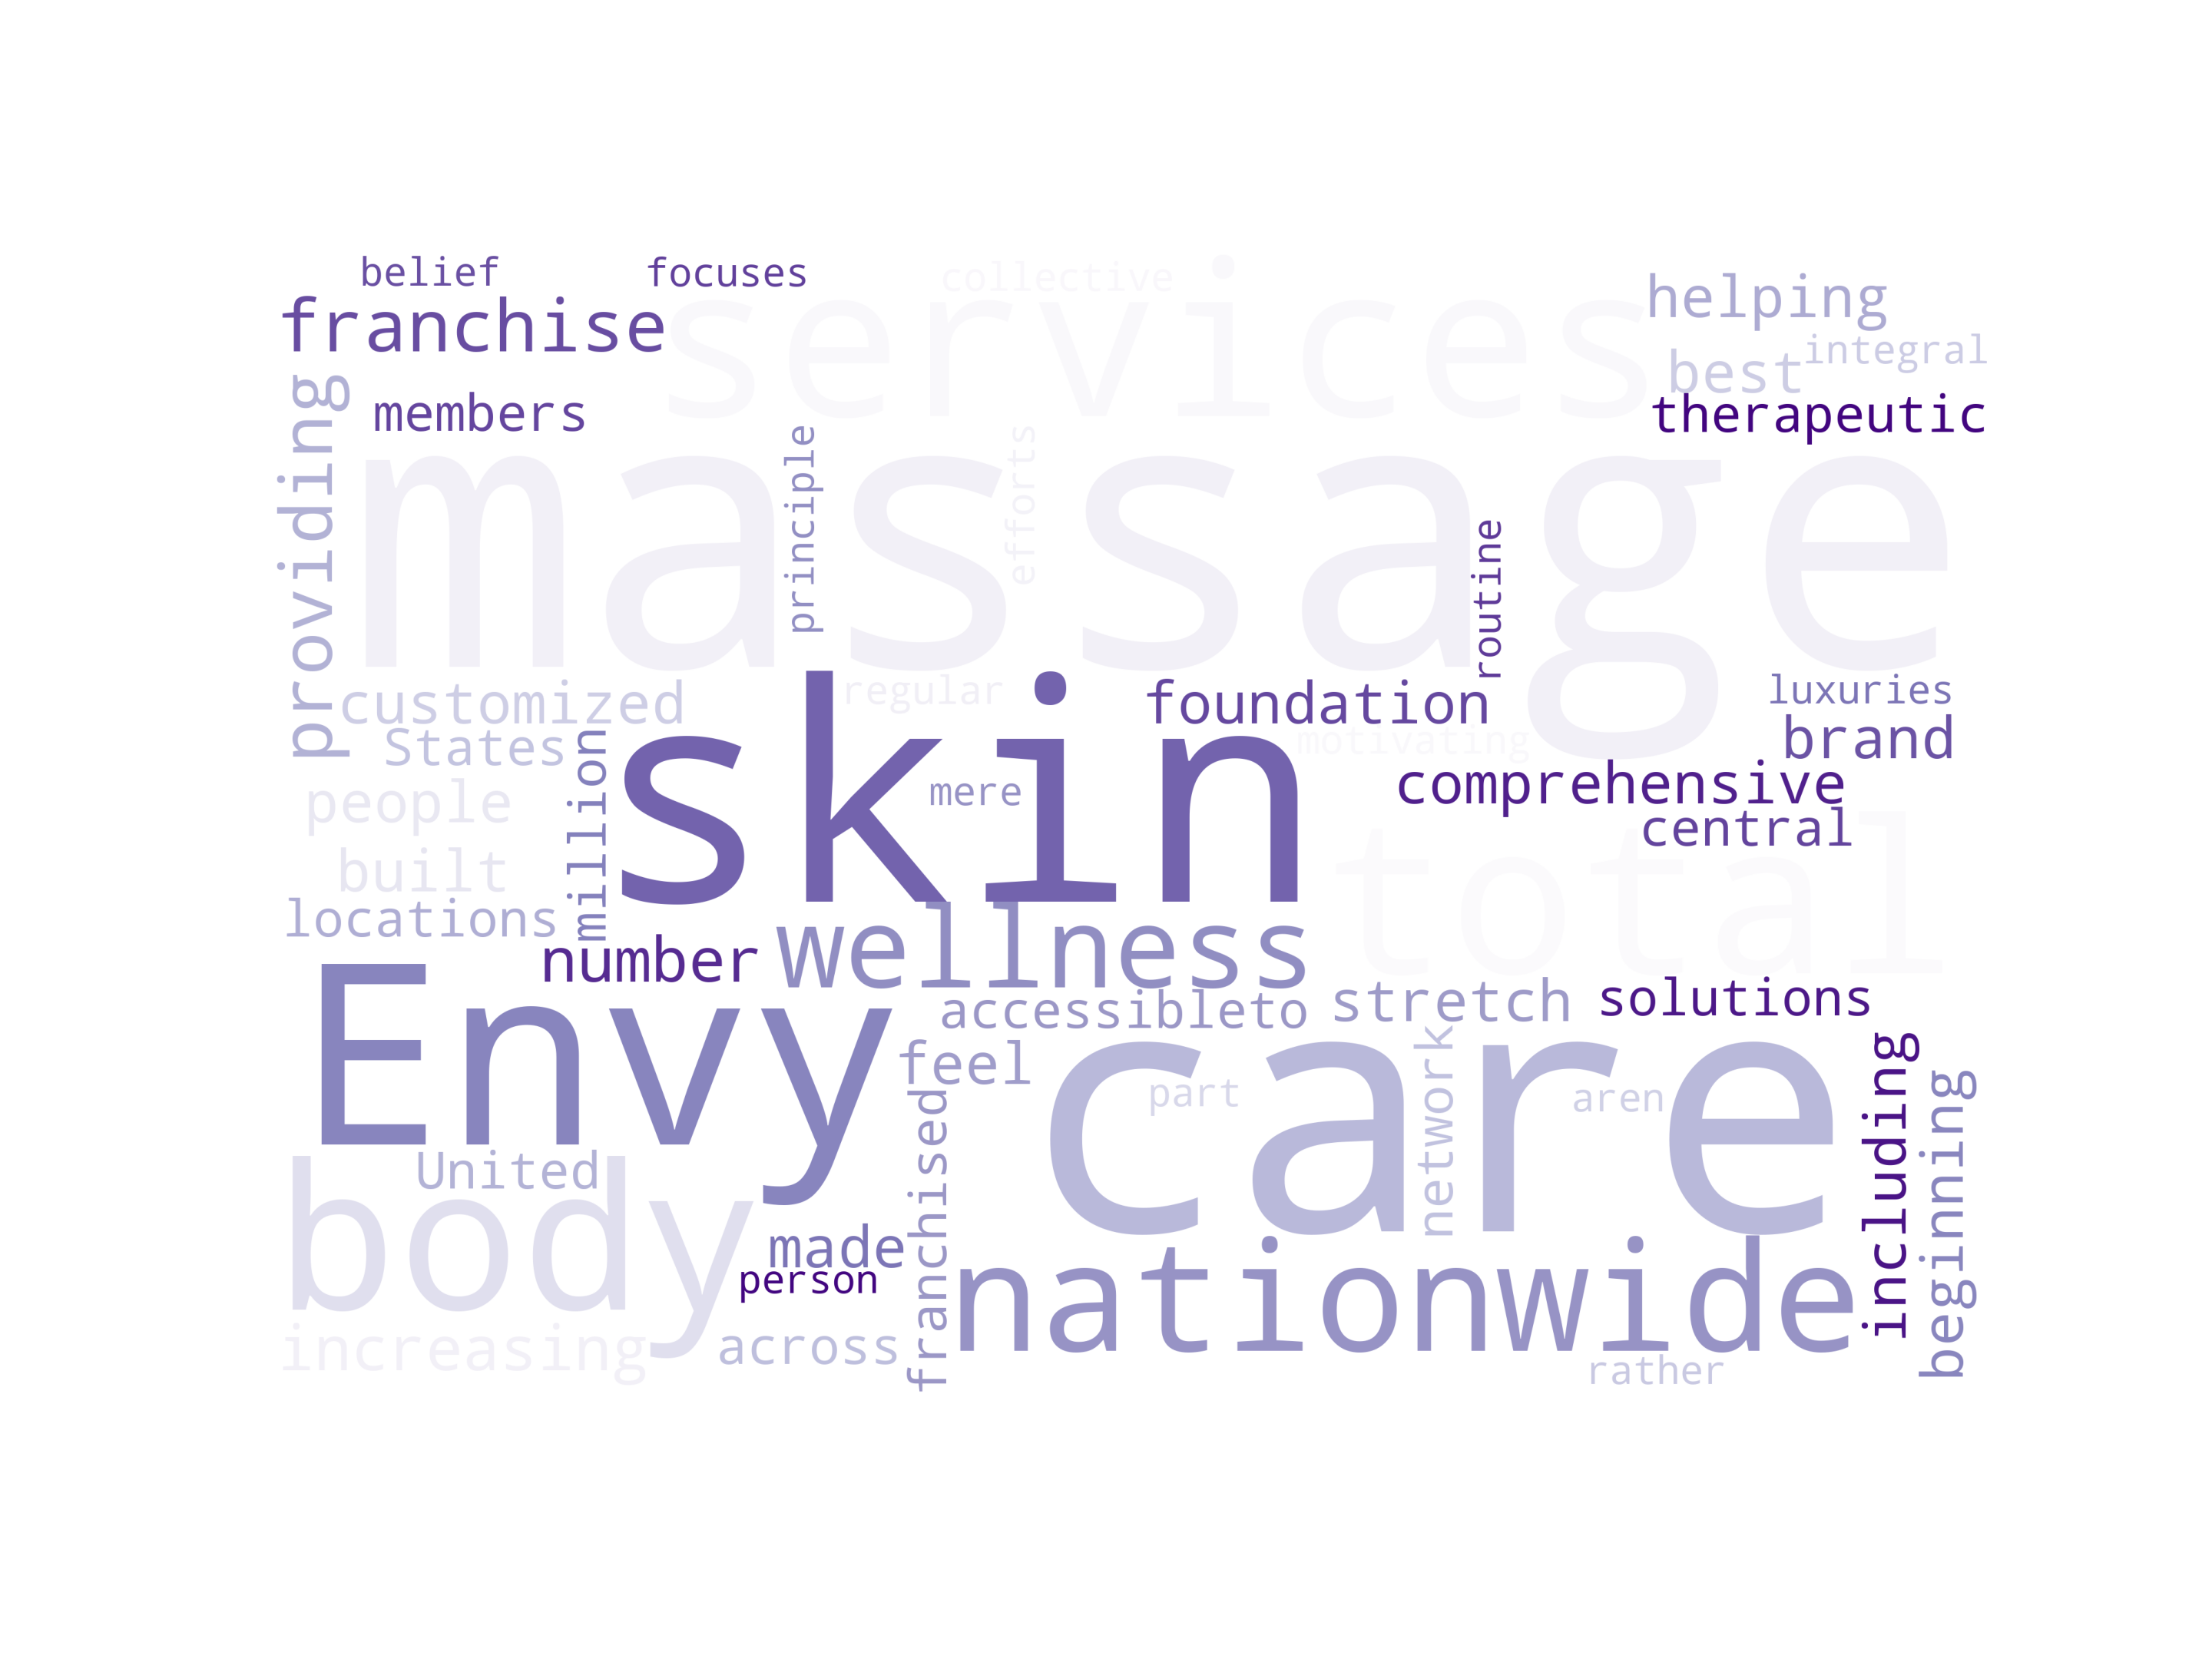
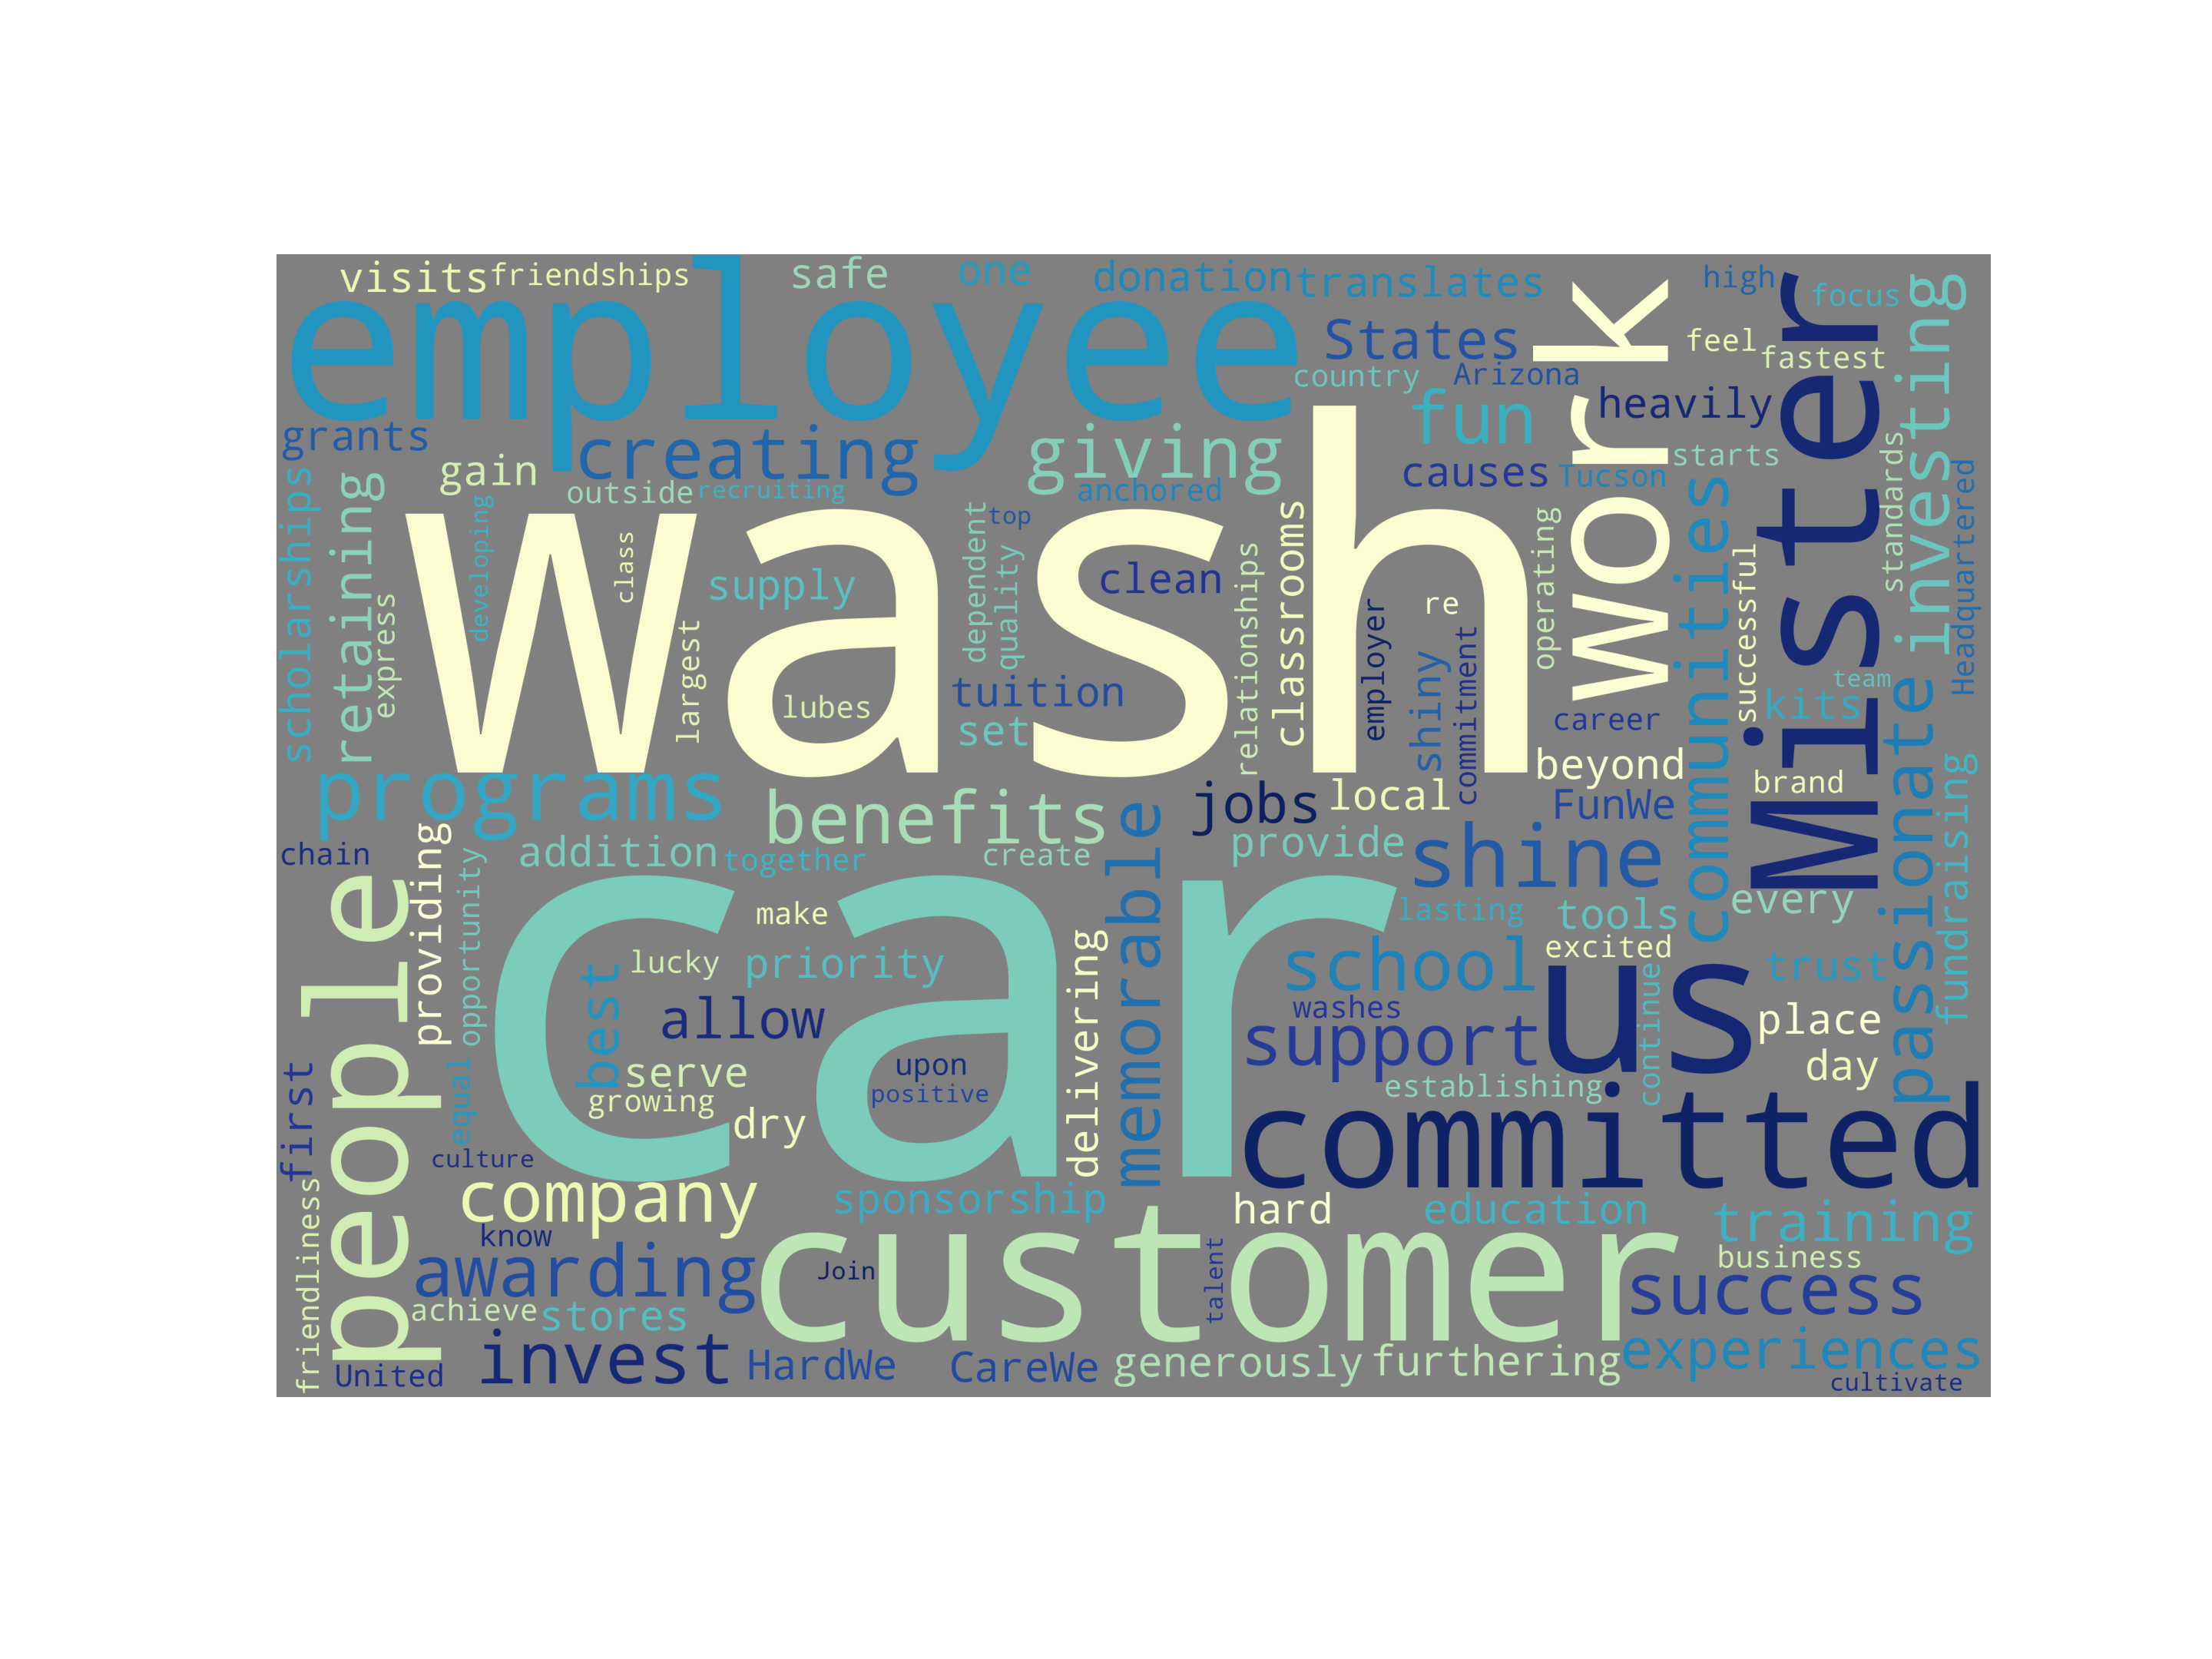
To get an idea of the values for the companies we were looking at, what better way to do so than a word cloud?
We took the mission statement from the company's website, and used Beautiful Soup to scrape the mission statement to only show the text. Sometimes the actual websites were unable to be scraped, but we could find the same statement in other places, such as "indeed.com". The mission statement was usually in the 'paragraph' element, and from there we cleaned it up to only show the sentences. Then, we used matplotlib to create the word cloud, and used a package named "STOPWORDS" to remove the filler words (such as "the", "it", etc). The word clouds shown below were customized to use colors from the company logo.


Perception
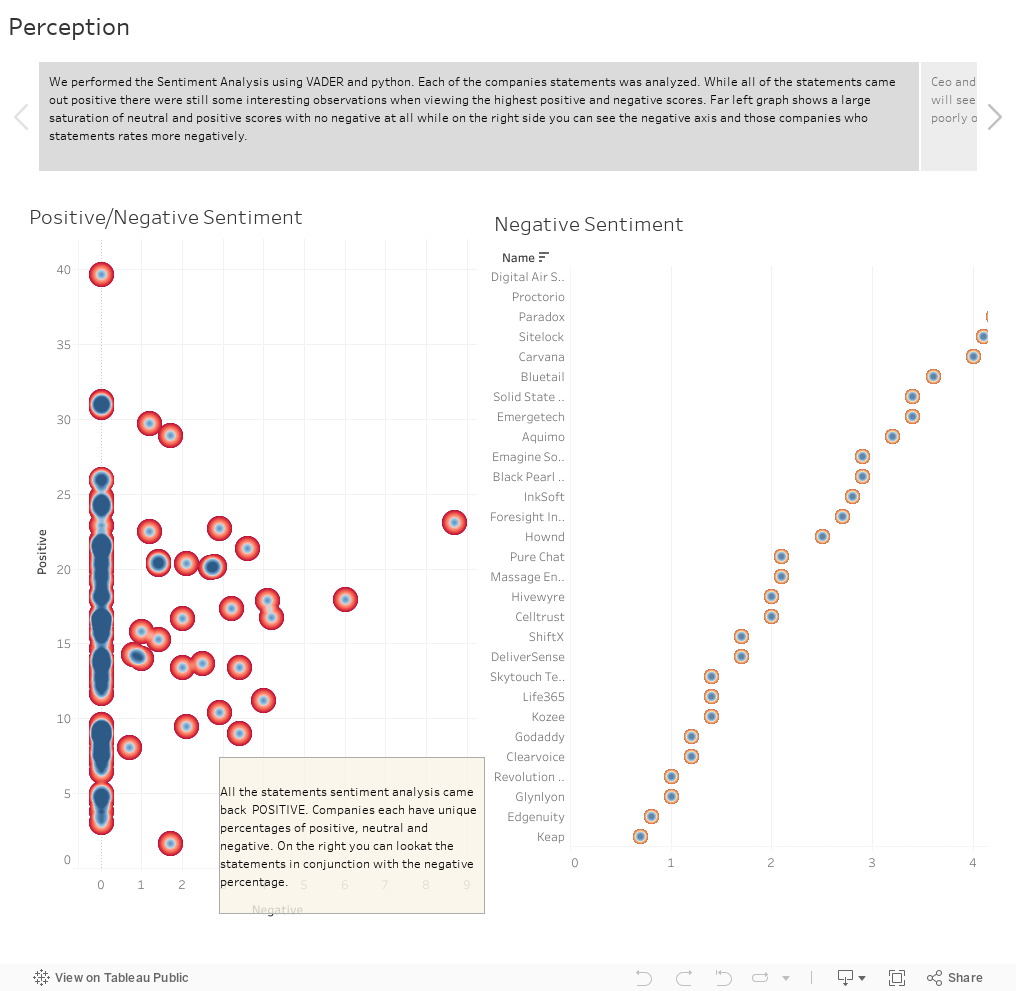
For many companies, perspective can be very important. Here we will look at how current and previous employees view the company, along with how they are viewed by their statement.
In the first set of charts, you can see the average rating on Glassdoor.com for referrals. We broke this in to two categories: the higher rated companies versus the lower rated companies. In the next chart, we show the average rating for each company on a scale from 1 to 5. This information was also provided from Glassdoor.com.
We wanted to dig a little deeper, so we created a chart that shows how a company is perceived by their statement. Using a sentiment analysis model called VADER and python, we were able to determine whether their statement was generally positive, neutral, or negative. All of the responses came back more positive than negative, however some companies had a more positive or negative rating than other companies.